Assessing PPL (PPL) Valuation After Recent Share Price Momentum And Grid Investment Plans
PPL Corporation PPL | 38.64 | +0.70% |
Why PPL (PPL) is on investors’ radar today
PPL (PPL) has drawn fresh attention after recent share price moves, with the stock closing at $37.82 and posting positive returns over the past week, month, past 3 months, and year.
For investors watching utilities, those steady gains, alongside reported annual revenue of $8.979b and net income of $1.09b, raise questions about how PPL’s current valuation lines up with its recent performance.
The recent 1-day share price return of 3.31% builds on PPL’s positive 7-day and year to date share price returns, while multi year total shareholder returns above 45% indicate that momentum has been supported over a longer horizon.
If steady utility names like PPL are on your watchlist, this could be a good moment to widen the field and check out 25 power grid technology and infrastructure stocks as potential next candidates to research.
With PPL trading at $37.82, annual revenue of $8.979b and net income of $1.09b, the key issue is whether the recent gains still leave room for additional upside or if the market is already fully pricing in expectations for future growth.
Most Popular Narrative: 4.7% Undervalued
At $37.82, PPL sits a little below the most widely followed fair value estimate of $39.67, which is built using a 6.98% discount rate.
The accelerating growth in data center construction and new economic development (particularly in Pennsylvania and Kentucky) is driving unprecedented electricity demand, positioning PPL for long-term rate base and revenue growth as it invests to serve these large new loads. Major planned grid infrastructure upgrades and generation capacity expansions, totaling $20B through 2028 (with potential additional investment from data center-driven transmission and new generation projects), are expected to support nearly 10% average annual rate base growth. This in turn would support higher regulated revenues and future earnings.
Want to see how steady revenue assumptions, higher margin forecasts, and a richer future earnings multiple all fit together into that $39.67 figure? The full narrative spells out the revenue path, profitability step up, and valuation multiple that need to hold for this pricing gap to make sense.
Result: Fair Value of $39.67 (UNDERVALUED)
However, the story depends heavily on regulators approving PPL’s US$20b investment plan and on large data center demand materialising as expected, both of which could disappoint.
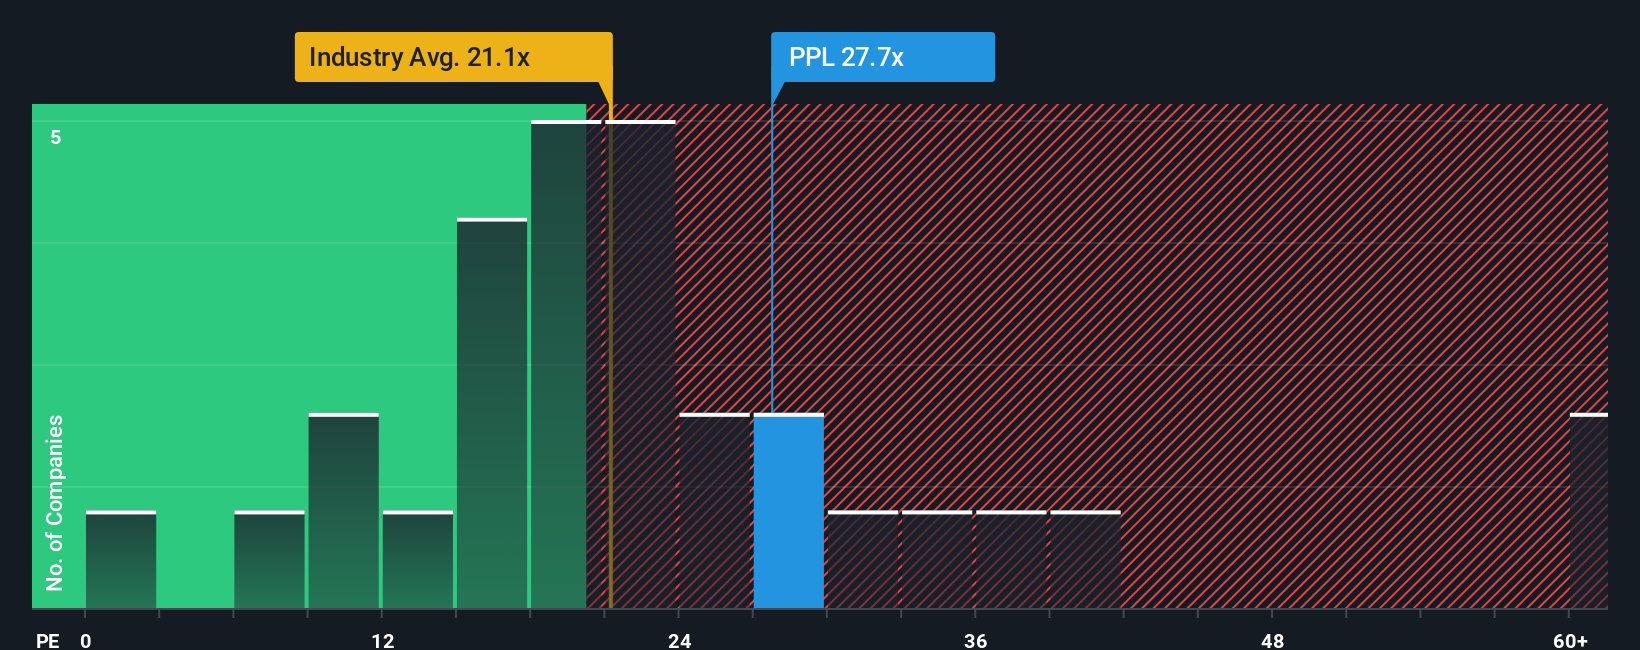
Another View: Earnings Multiple Sends A Different Signal
While the narrative-based fair value suggests PPL is about 4.7% undervalued at $37.82, the current P/E of 25.7x tells a different story. It sits above the US Electric Utilities industry at 22.4x and above the fair ratio of 24.7x. This points to a valuation that already reflects some optimism. If earnings or growth assumptions soften, how comfortable are you with paying that premium?
Build Your Own PPL Narrative
If parts of this story do not quite line up with how you see PPL, you can stress test the assumptions yourself and build a fresh view in just a few minutes, starting with Do it your way.
A great starting point for your PPL research is our analysis highlighting 2 key rewards and 2 important warning signs that could impact your investment decision.
Looking for more investment ideas?
If you stop with just one stock, you could miss other opportunities that fit your style, so keep stretching your watchlist with focused, high quality ideas.
- Target potential mispricings by scanning 53 high quality undervalued stocks that pair strong fundamentals with what could be more modest expectations baked into current prices.
- Lock in income potential by checking out 12 dividend fortresses that combine 5%+ yields with an emphasis on dependable payouts.
- Prioritise resilience by reviewing 84 resilient stocks with low risk scores designed for investors who want steadier balance sheets and lower overall risk scores.
This article by Simply Wall St is general in nature. We provide commentary based on historical data and analyst forecasts only using an unbiased methodology and our articles are not intended to be financial advice. It does not constitute a recommendation to buy or sell any stock, and does not take account of your objectives, or your financial situation. We aim to bring you long-term focused analysis driven by fundamental data. Note that our analysis may not factor in the latest price-sensitive company announcements or qualitative material. Simply Wall St has no position in any stocks mentioned.