Assessing Radware (RDWR) Valuation After New Agentic AI Protection Security Launch
Radware Ltd. RDWR | 27.20 | +0.67% |
Why Radware’s new AI security launch matters for shareholders
Radware (RDWR) has pushed further into AI security with its Agentic AI Protection Solution, a product aimed at tackling risks tied to AI agents, prompt attacks, tool abuse, and sensitive data exposure.
The launch builds on Radware’s work around threats like the recently identified ZombieAgent vulnerability and follows the earlier LLM Firewall release. Together, these developments give investors fresh context for thinking about how AI focused security products fit into the company’s broader cyber offering.
Against this product launch backdrop, Radware’s share price has climbed to $25.03, with a 90 day share price return of 8.45% and a 1 year total shareholder return of 8.64%. This suggests momentum has been building rather than fading over both shorter and longer periods.
If AI security is on your radar and you want to see what else fits that theme, take a look at our screener of 56 profitable AI stocks that aren't just burning cash as a starting point for further ideas.
With Radware trading at $25.03 and sitting about 22% below the average analyst price target of $30.67, the key question is simple: is this a genuine opportunity or is the market already baking in future growth?
Price-to-earnings of 65.2x: Is it justified?
Radware currently trades on a P/E of 65.2x, compared with a peer average of 29.2x and a US Software industry average of 26.9x, so the market is assigning a much richer earnings multiple to the stock than to many of its closest comparables.
The P/E ratio tells you how many dollars investors are paying today for each dollar of current earnings. It is particularly watched in software and cyber security where a lot of value is tied to expectations around future profitability and scale.
Here, earnings have declined by 20.6% per year over the past 5 years and return on equity sits at 4.3%. Forecasts point to revenue growth of 7.2% per year, which is slower than both the wider US market at 10.2% and the 20% threshold often used to flag very fast growth. A P/E more than double the peer and industry averages implies the market is willing to pay up for Radware despite modest growth forecasts and low current returns.
Compared with the US Software industry P/E of 26.9x, Radware’s 65.2x multiple stands out as expensive. This suggests investors are pricing in a very different earnings trajectory to that of the wider group, even though analysts currently expect the share price to move 22.5% higher from $25.03 to an average target of $30.67.
Result: Price-to-earnings of 65.2x (OVERVALUED)
However, you also need to weigh the risk that current earnings of $16.668m and a P/E of 65.2x leave little room for execution missteps or slower AI security adoption.
Another way to look at Radware’s value
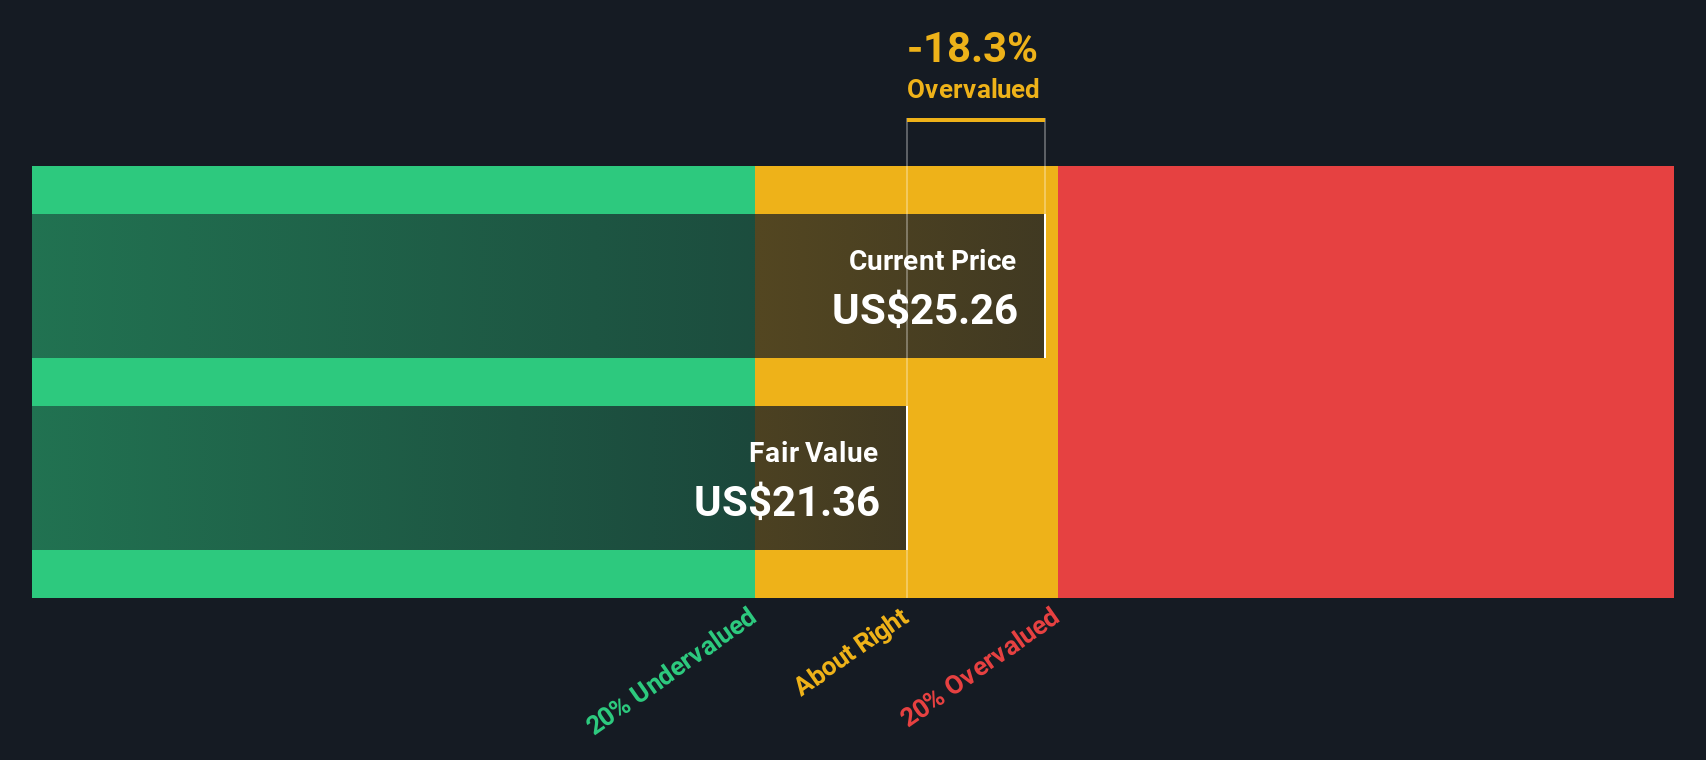
Our DCF model presents a different picture compared to the relatively high 65.2x P/E. On this view, Radware’s shares at $25.03 sit above an estimated future cash flow value of $18.01, which suggests an overvalued outcome and raises a simple question: what expectations are you really paying for?
Simply Wall St performs a discounted cash flow (DCF) on every stock in the world every day (check out Radware for example). We show the entire calculation in full. You can track the result in your watchlist or portfolio and be alerted when this changes, or use our stock screener to discover 52 high quality undervalued stocks. If you save a screener we even alert you when new companies match - so you never miss a potential opportunity.
Build Your Own Radware Narrative
If you see the numbers differently or want to stress test your own view against the data, you can build a personalised Radware story in just a few minutes, starting with Do it your way.
A great starting point for your Radware research is our analysis highlighting 2 key rewards and 2 important warning signs that could impact your investment decision.
Looking for more investment ideas?
If you stop with just one stock today, you could miss some very different opportunities that match your goals more closely and suit your risk comfort.
- Spot potential value opportunities early by scanning our list of 52 high quality undervalued stocks with solid fundamentals already in place.
- Prioritise resilience by focusing on 82 resilient stocks with low risk scores that score well on our risk checks and may suit a steadier approach.
- Get ahead of the crowd by checking our screener containing 24 high quality undiscovered gems that have quality metrics but sit off most investors’ radar.
This article by Simply Wall St is general in nature. We provide commentary based on historical data and analyst forecasts only using an unbiased methodology and our articles are not intended to be financial advice. It does not constitute a recommendation to buy or sell any stock, and does not take account of your objectives, or your financial situation. We aim to bring you long-term focused analysis driven by fundamental data. Note that our analysis may not factor in the latest price-sensitive company announcements or qualitative material. Simply Wall St has no position in any stocks mentioned.