Assessing Radware (RDWR) Valuation After New AI Security Discovery And Cloud Capacity Expansion
Radware Ltd. RDWR | 0.00 |
Radware (RDWR) is back on investors' radar after unveiling ZombieAgent, a zero-click indirect prompt injection vulnerability affecting OpenAI's Deep Research agent, and announcing a doubling of its global cloud security mitigation capacity.
These AI security headlines and the expansion of its cloud mitigation network come as Radware’s share price sits at US$24.06, with a 90 day share price return of a 7.5% decline but a 1 year total shareholder return of 10.52%, suggesting longer term holders have fared better than recent traders.
If this kind of AI security story has your attention, it could be a good moment to see what else is shaping the sector through high growth tech and AI stocks.
Radware now sits at US$24.06 with mixed short and long term returns, fresh AI security research, and a larger cloud protection footprint. So is the stock still underappreciated, or is the market already pricing in its future growth?
Price-to-Earnings of 62.7x: Is it justified?
Radware closed at US$24.06 and is trading on a P/E of 62.7x, which appears rich compared to both peers and the wider software space.
P/E looks at how much investors pay for each dollar of current earnings. For a security business like Radware it reflects what the market is willing to pay today for its profitability.
Here, the market is assigning a much higher price tag to Radware’s earnings than to its peers, which suggests investors are paying up for its recent move back into profitability or for its position in cyber security, rather than current earnings strength alone.
The contrast is sharp, with Radware’s 62.7x P/E sitting well above the peer average of 25.4x and the US Software industry average of 32.7x. This gap indicates the shares are currently priced at a premium rather than a discount.
Result: Price-to-Earnings of 62.7x
However, a rich 62.7x P/E, alongside a 15.9% 5 year total shareholder return decline and reliance on ongoing AI security interest, could challenge the current enthusiasm.
Another View: SWS DCF suggests overvaluation
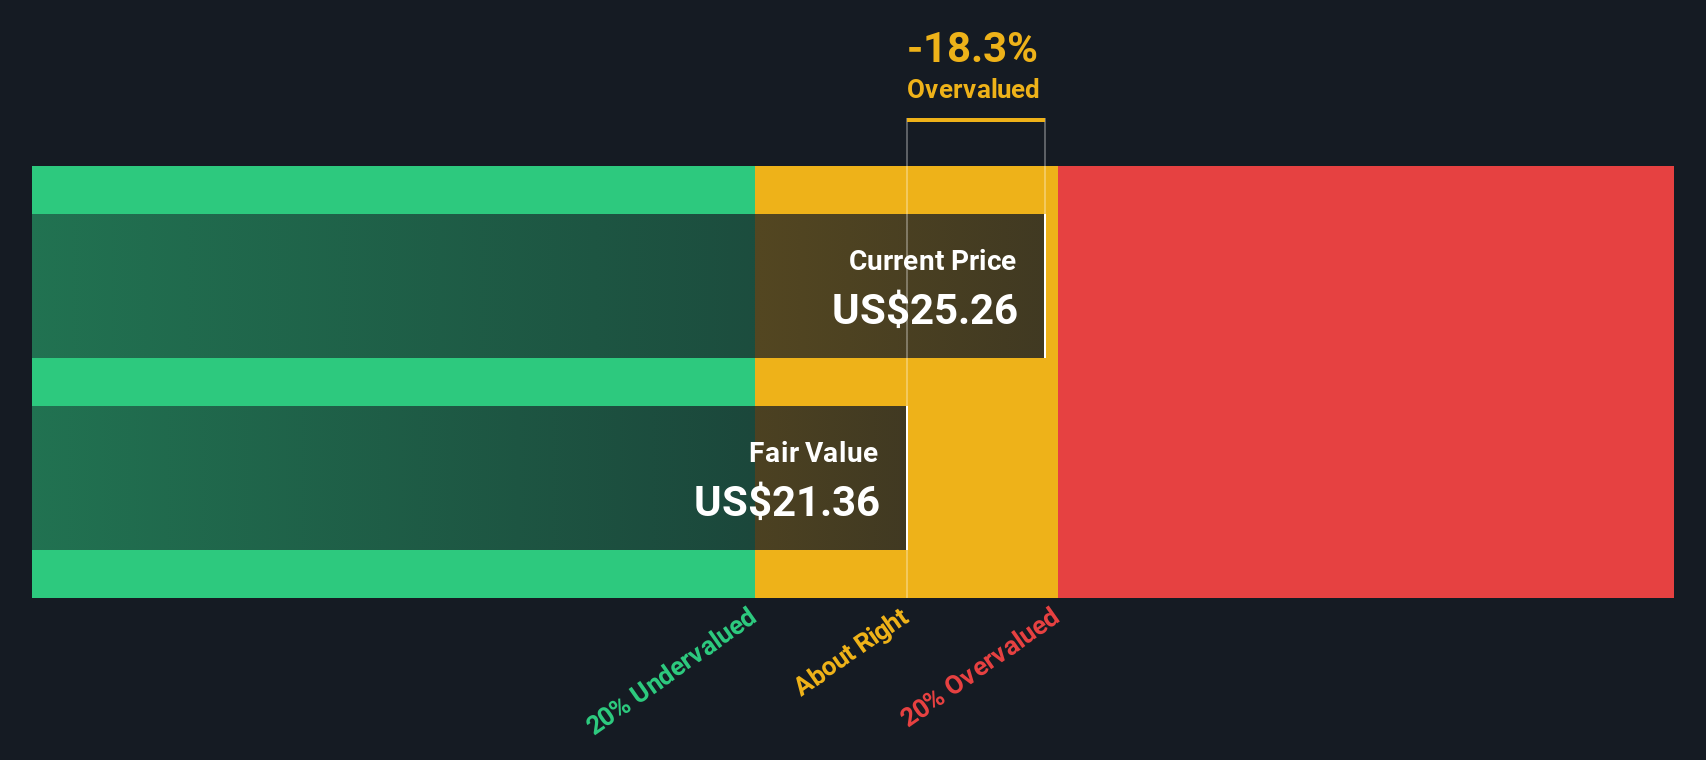
Our DCF model points in a different direction. At US$24.06, Radware is trading above an estimated fair value of US$17.30. This implies the shares may be pricing in more optimism than this cash flow view supports.
For you, that raises a simple question: Is the current price more about enthusiasm for AI security headlines than about underlying cash generation?
Simply Wall St performs a discounted cash flow (DCF) on every stock in the world every day (check out Radware for example). We show the entire calculation in full. You can track the result in your watchlist or portfolio and be alerted when this changes, or use our stock screener to discover 877 undervalued stocks based on their cash flows. If you save a screener we even alert you when new companies match - so you never miss a potential opportunity.
Build Your Own Radware Narrative
If you would rather evaluate the numbers yourself and reach your own conclusion, you can pull together a personalised Radware view in minutes, starting with Do it your way.
A great starting point for your Radware research is our analysis highlighting 2 key rewards and 2 important warning signs that could impact your investment decision.
Ready for more investing ideas?
If Radware is on your radar, do not stop there. Widen your watchlist with a few focused stock ideas that could sharpen your next move.
- Spot potential value by scanning these 877 undervalued stocks based on cash flows that line up current prices with underlying cash flow strength.
- Explore technology themes by checking out these 28 AI penny stocks tied to artificial intelligence trends across different parts of the market.
- Consider income-focused ideas through these 11 dividend stocks with yields > 3% that offer yields above 3% and could complement growth-focused holdings.
This article by Simply Wall St is general in nature. We provide commentary based on historical data and analyst forecasts only using an unbiased methodology and our articles are not intended to be financial advice. It does not constitute a recommendation to buy or sell any stock, and does not take account of your objectives, or your financial situation. We aim to bring you long-term focused analysis driven by fundamental data. Note that our analysis may not factor in the latest price-sensitive company announcements or qualitative material. Simply Wall St has no position in any stocks mentioned.