Assessing S&P Global (SPGI) Valuation After Recent Share Price Weakness And P/E Premium To Peers
S&P Global, Inc. SPGI | 425.24 | -1.13% |
What recent moves in S&P Global (SPGI) might signal to investors
S&P Global (SPGI) has been under pressure recently, with the share price showing negative returns over the past week, month, past 3 months and year, which is drawing fresh attention from investors.
The recent 14.6% 7 day share price decline, alongside an 11.9% year to date share price decline and a 12.3% 1 year total shareholder return decline, suggests momentum has been fading even though longer term 3 and 5 year total shareholder returns remain positive.
If this pullback has you reassessing your watchlist, it could be a good moment to see what else is out there with our 22 top founder-led companies.
With SPGI trading at $451.71 against an analyst price target of $622.74 and an intrinsic value estimate that sits at a premium to today’s price, is this a genuine entry point, or is the market already baking in future growth?
Most Popular Narrative: 10.5% Undervalued
With S&P Global’s most followed fair value estimate at $504.91 and the last close at $451.71, the current gap is all about what the future earnings path could justify.
The vibrant equity and debt markets in the first quarter, evidenced by strong IPO, M&A, and the highest level of debt issuance since 2021, signal a growing demand for S&P Global's ratings services, which could enhance future revenues in the Ratings division. An increasing shift from private to public debt refinancing, propelled by issuers seeking to save up to 200 basis points on interest rates, might lead to a higher demand for public ratings and analytical solutions, positively impacting Ratings division revenue.
Curious how a premium earnings multiple, rising profitability and a detailed earnings path all fit together here? The narrative leans on a specific growth runway, firm margin assumptions and a tight range of forecasts. Want to see exactly how those moving parts support that fair value number?
Result: Fair Value of $504.91 (UNDERVALUED)
However, you still need to weigh the risk that issuance slows if financing conditions tighten or that heavy AI and product spending pressures margins more than expected.
Another View: What Earnings Ratios Are Signalling
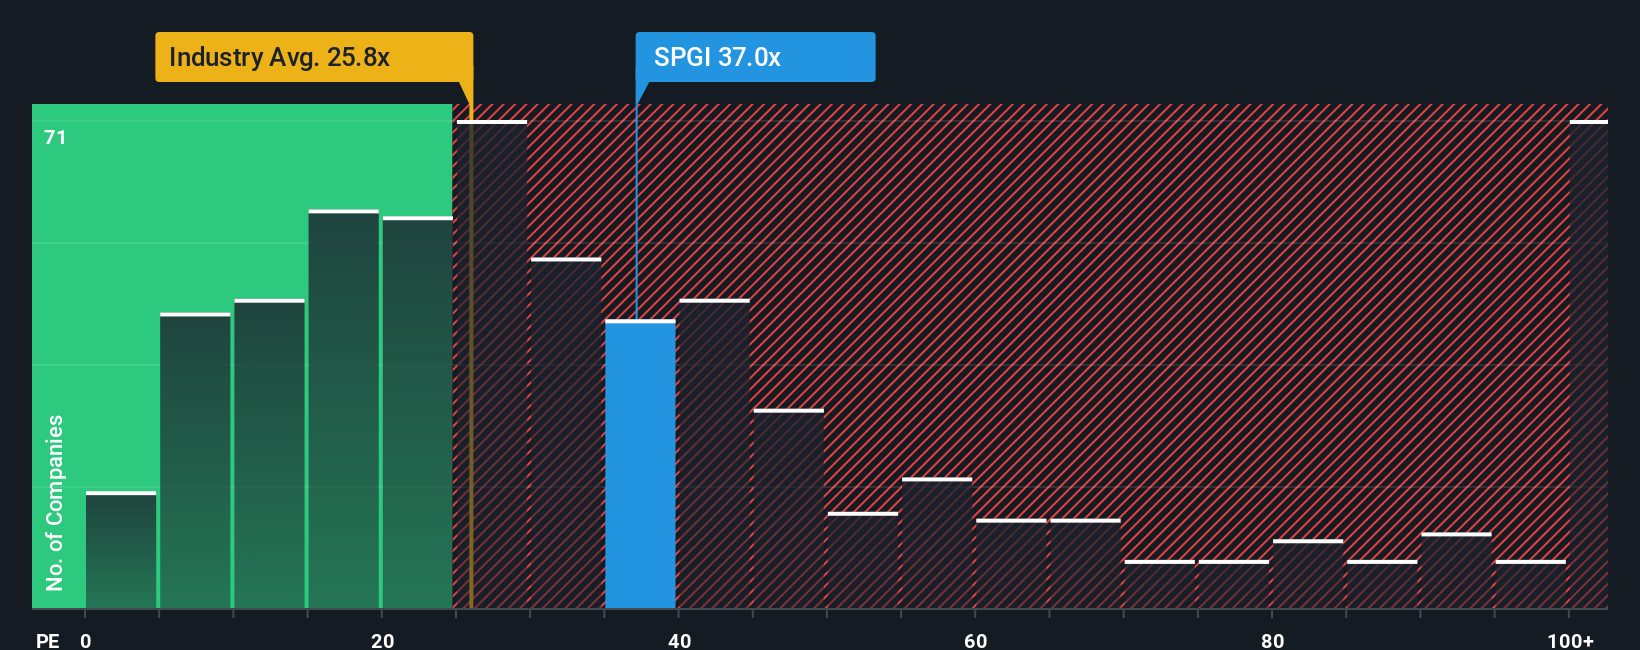
That 10.5% gap to the $504.91 fair value rests on an earnings path that many analysts see as reasonable. However, on simple P/E math, S&P Global trades at 32.4x, which is higher than peers at 30.2x and well above a fair ratio of 19x. The risk is that sentiment cools faster than earnings grow.
Put differently, you are paying more than both the industry average and the fair ratio suggests the market could move toward. The question is whether you are being compensated enough for that extra optimism.
Build Your Own S&P Global Narrative
If you see the numbers differently or simply prefer to test your own view, you can build a custom thesis for S&P Global in just a few minutes, starting with Do it your way.
A good starting point is our analysis highlighting 3 key rewards investors are optimistic about regarding S&P Global.
Looking for more investment ideas?
If you are serious about tightening your process, do not stop at one stock. Use the Simply Wall St screener to surface fresh opportunities aligned with your goals.
- Target long term compounding potential by checking out our 55 high quality undervalued stocks that line up strong fundamentals with appealing prices.
- Strengthen your income stream by scanning 15 dividend fortresses that could help anchor a reliable cash return profile.
- Prioritise resilience first by reviewing our 81 resilient stocks with low risk scores designed to keep overall portfolio risk in check.
This article by Simply Wall St is general in nature. We provide commentary based on historical data and analyst forecasts only using an unbiased methodology and our articles are not intended to be financial advice. It does not constitute a recommendation to buy or sell any stock, and does not take account of your objectives, or your financial situation. We aim to bring you long-term focused analysis driven by fundamental data. Note that our analysis may not factor in the latest price-sensitive company announcements or qualitative material. Simply Wall St has no position in any stocks mentioned.