Assessing Star Bulk Carriers (SBLK) Valuation As Strong Multi‑Year Returns Draw Investor Attention
Star Bulk Carriers Corp. SBLK | 0.00 |
Why Star Bulk Carriers is on investors’ radar today
Star Bulk Carriers (SBLK) has drawn fresh attention after recent share price moves, with the stock showing double digit total returns over the past year, 3 years and 5 years.
The recent 1-day share price return of 5.45% to $26.68 adds to a 37.74% year to date share price return and a 1-year total shareholder return of 82.95%. This points to strong, sustained momentum rather than a short term spike.
If Star Bulk Carriers has sharpened your interest in shipping, it may be worth widening your search to other infrastructure style opportunities via our 35 power grid technology and infrastructure stocks
With Star Bulk Carriers trading at $26.68 against an analyst price target of $29.98 and an estimated intrinsic value gap of around 55%, investors may ask whether there is still an opportunity here or if the market is already pricing in future growth.
Most Popular Narrative: 13.9% Overvalued
Compared with the last close of $26.68, the most widely followed narrative points to a fair value of $23.43, framing the recent share price strength in a different light.
Limited new vessel supply, caused by a historically low orderbook, strong shipyard constraints, and uncertainty around future green technologies, should maintain a tight tonnage market through 2027, allowing Star Bulk to benefit from stronger utilization and higher time charter revenues.
Want to see what sits behind that view on utilization and day rates? The narrative leans heavily on future margins, capital returns, and a compressed earnings multiple.
Result: Fair Value of $23.43 (OVERVALUED)
However, there are clear pressure points, including high leverage of US$1.12b against US$407m cash and an aging fleet that may require significant capital expenditure just to maintain its current position.
Another Angle on Value: Cash Flows Tell a Different Story
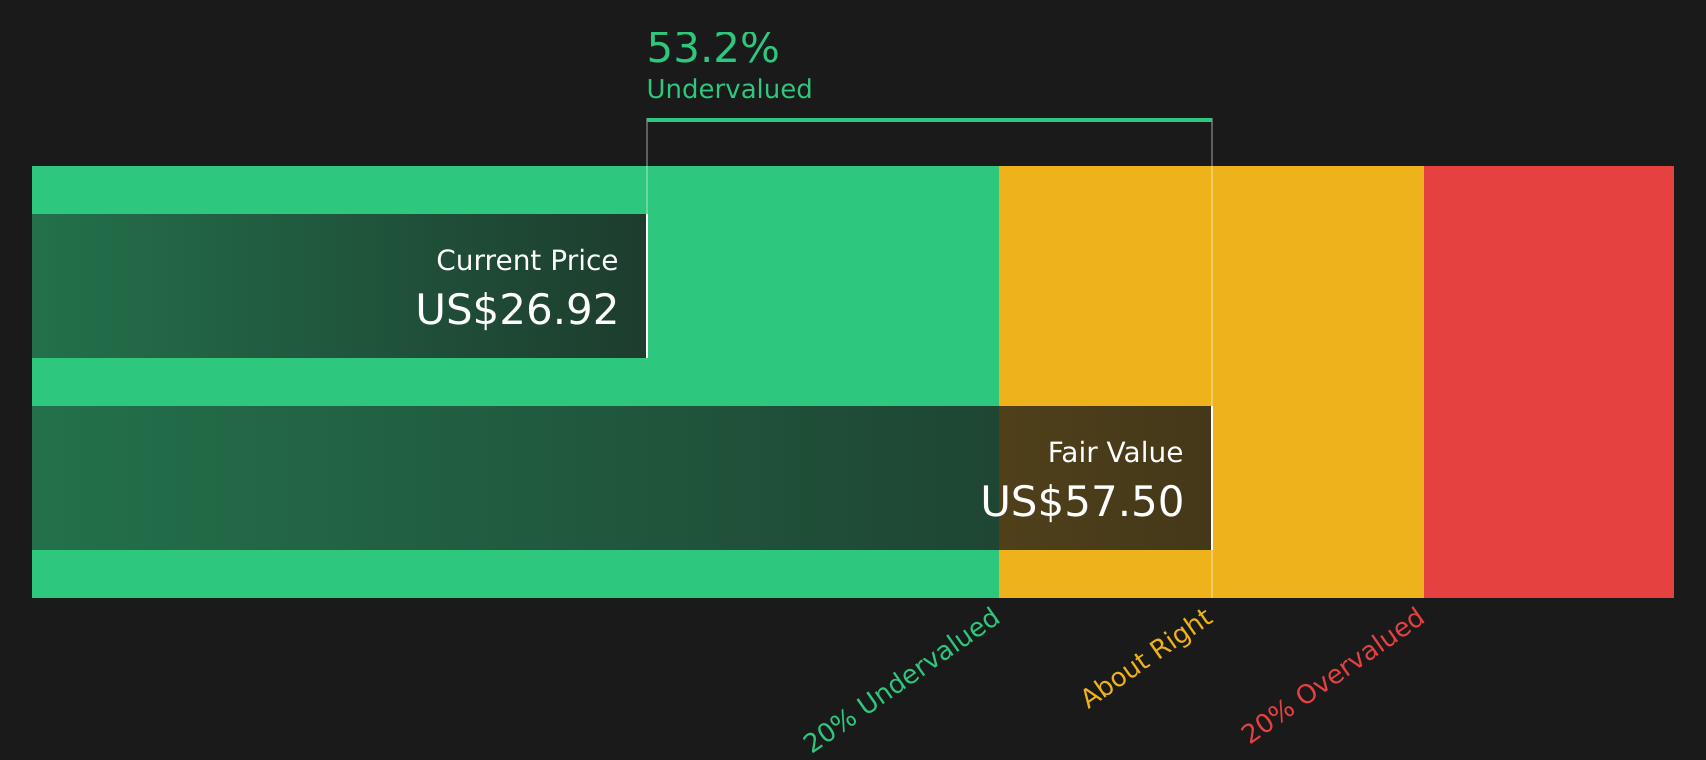
While the consensus narrative points to Star Bulk Carriers being about 13.9% overvalued at $26.68 versus a fair value of $23.43, the SWS DCF model presents a very different perspective, with a future cash flow value of $59.36 suggesting the stock trades at a steep discount. Which lens do you trust more when the signals conflict this sharply?
Simply Wall St performs a discounted cash flow (DCF) on every stock in the world every day (check out Star Bulk Carriers for example). We show the entire calculation in full. You can track the result in your watchlist or portfolio and be alerted when this changes, or use our stock screener to discover 51 high quality undervalued stocks. If you save a screener we even alert you when new companies match - so you never miss a potential opportunity.
Next Steps
With such mixed signals around value, momentum, and balance sheet risk, it makes sense to review the data yourself and act promptly to form your own view, starting with these 2 key rewards and 3 important warning signs.
Looking for more investment ideas?
If you stop with just one stock, you may miss opportunities that fit your goals even better, so use the tools available and keep your options open.
- Target companies that combine quality and value by scanning for 51 high quality undervalued stocks that may offer robust fundamentals at prices that still look reasonable.
- Prioritize income potential by reviewing 13 dividend fortresses that focus on stronger yields for investors who want regular cash returns.
- Reduce portfolio stress by concentrating on 72 resilient stocks with low risk scores that score well on financial strength and lower overall risk profiles.
This article by Simply Wall St is general in nature. We provide commentary based on historical data and analyst forecasts only using an unbiased methodology and our articles are not intended to be financial advice. It does not constitute a recommendation to buy or sell any stock, and does not take account of your objectives, or your financial situation. We aim to bring you long-term focused analysis driven by fundamental data. Note that our analysis may not factor in the latest price-sensitive company announcements or qualitative material. Simply Wall St has no position in any stocks mentioned.