Assessing StoneX Group (SNEX) Valuation After Record Q2 Results And R.J. O’Brien Integration Progress
StoneX Group Inc. SNEX | 0.00 |
StoneX Group (SNEX) is back in focus after reporting record Q2 2026 results, with revenue of US$45,760.9m and net income of US$174.3m, as well as further progress integrating R.J. O’Brien.
The strong Q2 report has coincided with intense buying interest, with a 1 day share price return of 13.64% and a 30 day share price return of 39.14%. The 5 year total shareholder return of 489.56% points to powerful long term momentum.
If StoneX’s move has you thinking about what else is gaining attention, this could be a good moment to scan 19 top founder-led companies for potential new ideas.
After a jumpy run that has pushed the stock close to its US$123 analyst target, and with an intrinsic value estimate indicating a small premium, you now have to ask: is there still a buying opportunity here, or is the market already pricing in future growth?
Preferred Price-to-Earnings of 21.4x: Is it justified?
On a P/E of 21.4x, StoneX Group is trading at a richer level than its own fair P/E estimate and its peer group, even though it sits below the broader industry average.
The P/E ratio compares the company’s share price with its earnings per share, so a higher P/E usually means investors are willing to pay more today for each dollar of current earnings. For a diversified financial services company like StoneX, that can reflect expectations around earnings resilience, growth from its various segments, and the quality of those earnings.
Here, the stock’s 21.4x P/E stands above the fair P/E estimate of 14.5x. This gap suggests the market is assigning a premium relative to what the fair ratio implies the valuation could settle toward. It is also higher than the peer average P/E of 16.7x, which indicates investors are currently willing to pay more for StoneX than for similar companies, while still paying less than the wider US Capital Markets industry, which trades on an average P/E of 42.8x.
Result: Price-to-Earnings of 21.4x (OVERVALUED)
However, there are still risks here, including the premium to fair P/E estimates and the possibility that recent strong share price gains could cool investor enthusiasm.
Another View: What Does The DCF Say?
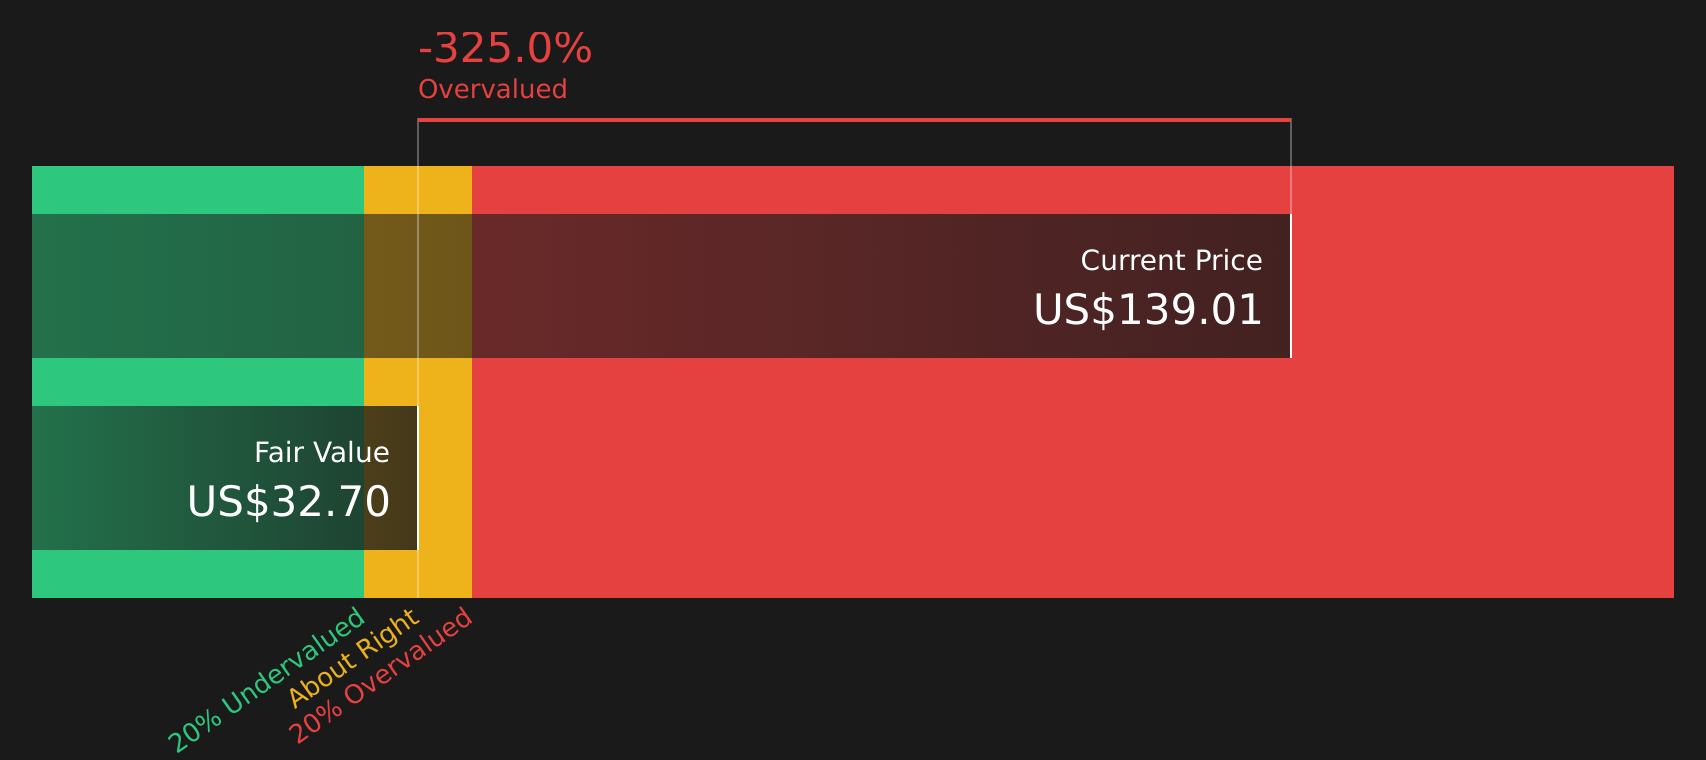
While the P/E ratio suggests StoneX is expensive relative to peers but cheaper than the broader industry, the SWS DCF model points the other way. With the stock at $120.9 versus a DCF value of $31.31, this method implies it is significantly overvalued. Which signal should carry more weight for you?
Simply Wall St performs a discounted cash flow (DCF) on every stock in the world every day (check out StoneX Group for example). We show the entire calculation in full. You can track the result in your watchlist or portfolio and be alerted when this changes, or use our stock screener to discover 50 high quality undervalued stocks. If you save a screener we even alert you when new companies match - so you never miss a potential opportunity.
Next Steps
If this mix of signals leaves you undecided, that is a healthy place to be. Move quickly to weigh the potential benefits by reviewing the 3 key rewards.
Ready to uncover more opportunities?
If StoneX has caught your attention, do not stop here. Use this momentum to broaden your watchlist with stocks that match the kind of portfolio you want to build.
- Target potential bargains by scanning for companies that look mispriced on quality and fundamentals with the 50 high quality undervalued stocks.
- Strengthen the defensive side of your portfolio by focusing on businesses with robust finances using the solid balance sheet and fundamentals stocks screener (46 results).
- Get ahead of the crowd by spotting smaller, underfollowed stocks through the screener containing 21 high quality undiscovered gems.
This article by Simply Wall St is general in nature. We provide commentary based on historical data and analyst forecasts only using an unbiased methodology and our articles are not intended to be financial advice. It does not constitute a recommendation to buy or sell any stock, and does not take account of your objectives, or your financial situation. We aim to bring you long-term focused analysis driven by fundamental data. Note that our analysis may not factor in the latest price-sensitive company announcements or qualitative material. Simply Wall St has no position in any stocks mentioned.