Assessing Summit Therapeutics (SMMT) Valuation After Ivonescimab FDA Filing And New GSK Trial Collaboration
Summit Therapeutics Inc SMMT | 19.38 | +2.43% |
Summit Therapeutics (SMMT) has drawn fresh attention after submitting a Biologics License Application for its lead drug ivonescimab in advanced lung cancer and pairing it with a new combination trial collaboration with GSK.
Despite the fresh clinical news and collaboration headlines, Summit Therapeutics' 7 day share price return of 9.91% and 90 day share price return of 25.75% are negative. However, its 3 year total shareholder return of about 7x suggests earlier momentum that has cooled more recently.
If ivonescimab has caught your attention and you want to see what else is happening in oncology, it could be a good moment to scan healthcare stocks for other ideas.
With shares recently at US$16.81, sitting at a deep discount to the US$32.64 analyst target and an intrinsic value estimate that is also higher, you have to ask: is there a mispricing here, or is the market already baking in future growth?
Price to Book of 67.4x: Is it justified?
On the numbers, Summit Therapeutics looks extremely expensive on a P/B basis, with a 67.4x multiple versus a sector where single digit ratios are more typical.
P/B compares the market value of the company to its net assets on the balance sheet, so a high ratio usually means investors are paying a large premium over accounting equity. For early stage biopharma firms that are loss making and pre revenue, that premium often reflects expectations around future drug cash flows rather than today’s book value.
In this case, the gap is very wide. Summit’s 67.4x P/B is far above the US Biotechs industry average of 2.6x and also well above its peer average of 10.6x, implying the market is pricing in much richer prospects than the typical biotech peer group.
Result: Price to Book of 67.4x (OVERVALUED)
However, you still need to weigh the binary clinical risk around ivonescimab’s Phase III trials, as well as the fact that Summit currently reports no revenue and a sizeable net loss.
Another angle on value: DCF vs sky high P/B
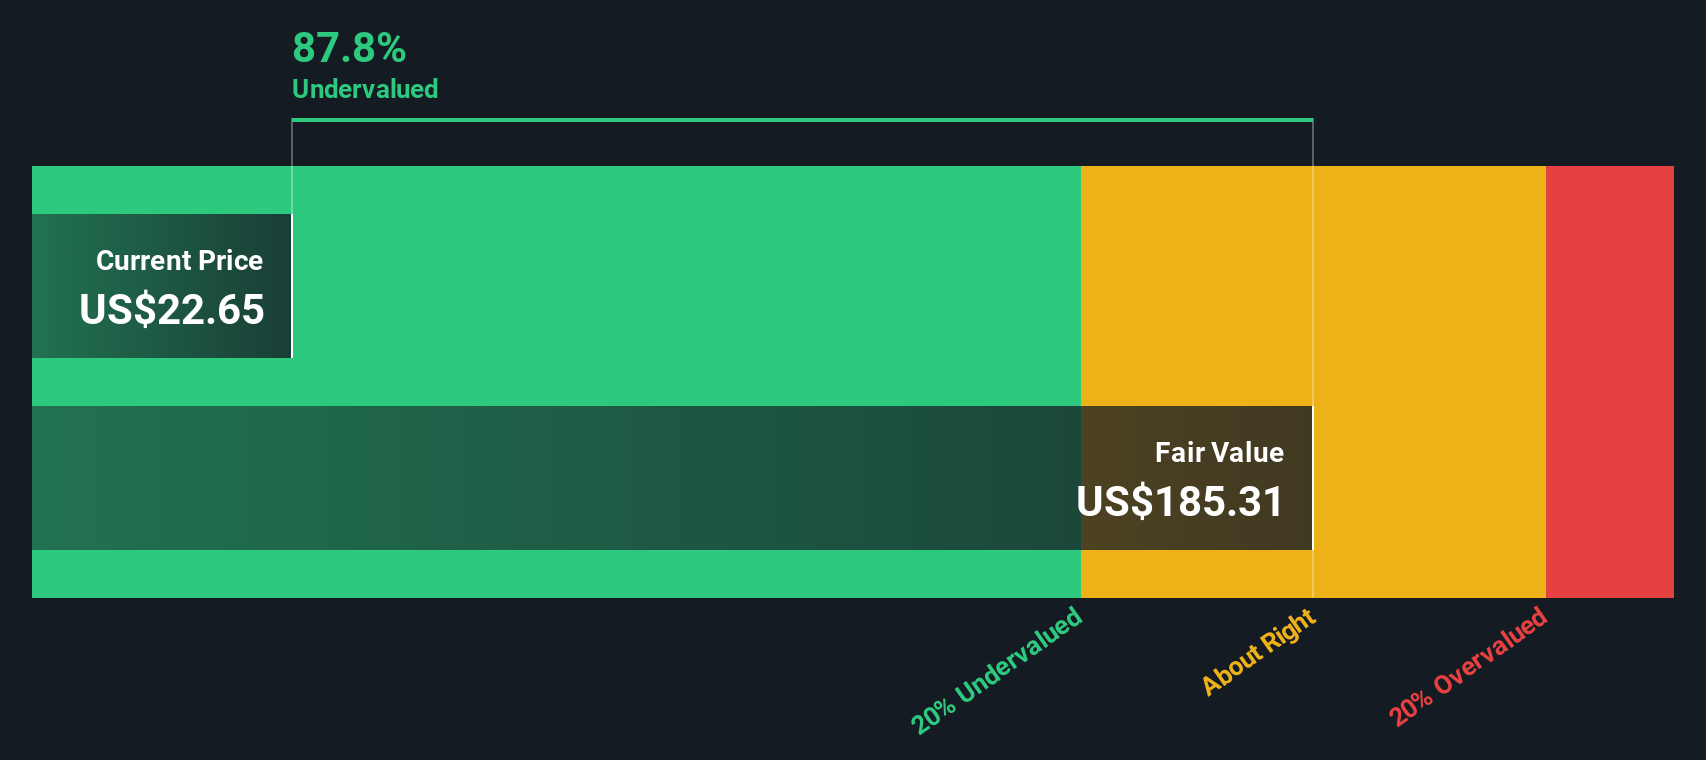
While the 67.4x P/B ratio makes Summit Therapeutics look extremely expensive, our DCF model points in the opposite direction, suggesting the shares trade about 92.3% below an estimated fair value of US$217.63. One model flags rich expectations and the other a big discount, so which story do you think fits better?
Simply Wall St performs a discounted cash flow (DCF) on every stock in the world every day (check out Summit Therapeutics for example). We show the entire calculation in full. You can track the result in your watchlist or portfolio and be alerted when this changes, or use our stock screener to discover 888 undervalued stocks based on their cash flows. If you save a screener we even alert you when new companies match - so you never miss a potential opportunity.
Build Your Own Summit Therapeutics Narrative
If this perspective does not fully reflect how you view Summit, you can review the same data, shape your own story in minutes, then Do it your way.
A great starting point for your Summit Therapeutics research is our analysis highlighting 2 key rewards and 2 important warning signs that could impact your investment decision.
Ready to uncover your next idea?
If Summit feels like just one piece of the puzzle, use this moment to line up a few more candidates and keep your watchlist working harder for you.
- Spot potential value gaps by scanning these 888 undervalued stocks based on cash flows that appear to trade below what their cash flows suggest.
- Ride powerful technology shifts by reviewing these 25 AI penny stocks that are linked to artificial intelligence themes.
- Strengthen your income focus by checking out these 13 dividend stocks with yields > 3% that might offer yields above 3%.
This article by Simply Wall St is general in nature. We provide commentary based on historical data and analyst forecasts only using an unbiased methodology and our articles are not intended to be financial advice. It does not constitute a recommendation to buy or sell any stock, and does not take account of your objectives, or your financial situation. We aim to bring you long-term focused analysis driven by fundamental data. Note that our analysis may not factor in the latest price-sensitive company announcements or qualitative material. Simply Wall St has no position in any stocks mentioned.