Assessing Swarmer (SWMR) Valuation After CNBC Spotlight And New U.S. Defense Contract
Swarmer SWMR | 0.00 |
Media spotlight and defense contract put Swarmer in focus
Investor attention around Swarmer (SWMR) has picked up after Jim Cramer highlighted the military drone company on CNBC and the stock moved sharply, coinciding with news of a new U.S. defense contract.
The recent CNBC spotlight and fresh U.S. defense contract arrive on top of very strong recent momentum, with a 1-day share price return of 37.7%, a 7-day share price return of 77.4%, a 30-day share price return of 113.1% and a year to date share price return of 153.3%. This suggests investors are rapidly repricing Swarmer’s potential and risk profile in the military drone and AI software space.
If this surge has you looking beyond a single stock, it could be a useful moment to scan other AI related opportunities through our screener of 62 profitable AI stocks that aren't just burning cash
With Swarmer now trading above its latest analyst price target and reporting a loss on just over $219,000 of revenue, investors may need to consider whether there is still mispricing or whether the market is already accounting for potential future growth.
Preferred price to book of 36.7x, is it justified?
Swarmer is currently trading on a P/B of 36.7x compared with a peer average of 3.7x and a US Aerospace & Defense industry average of 3.8x, which points to a very rich valuation relative to book value.
The P/B ratio compares the company’s market value to the accounting value of its net assets and is often used for capital intensive sectors like aerospace and defense where tangible assets and balance sheet strength matter. A P/B far above peers usually means investors are assigning a premium to future prospects or intangible assets, rather than what is on the balance sheet today.
Given Swarmer’s small revenue base of about $220K, current loss of $12.29m and forecast revenue growth of 79% per year, that premium P/B suggests the market is already pricing in a lot of future execution on its autonomous drone and AI software platform. The company’s negative return on equity of 52.27% and lack of a long public track record add to the contrast with that high multiple.
Compared with the US Aerospace & Defense industry average P/B of 3.8x, Swarmer’s 36.7x ratio is an order of magnitude higher, indicating the stock is trading well above what investors pay on average for the sector. Without an estimated fair P/B ratio, there is no regression based level to point to as a potential anchor, but the gap to peers is still stark.
Result: Price-to-book of 36.7x (OVERVALUED).
However, Swarmer’s small revenue base, ongoing net loss and reliance on military contracts mean that any contract delays or execution setbacks could quickly challenge today’s rich pricing.
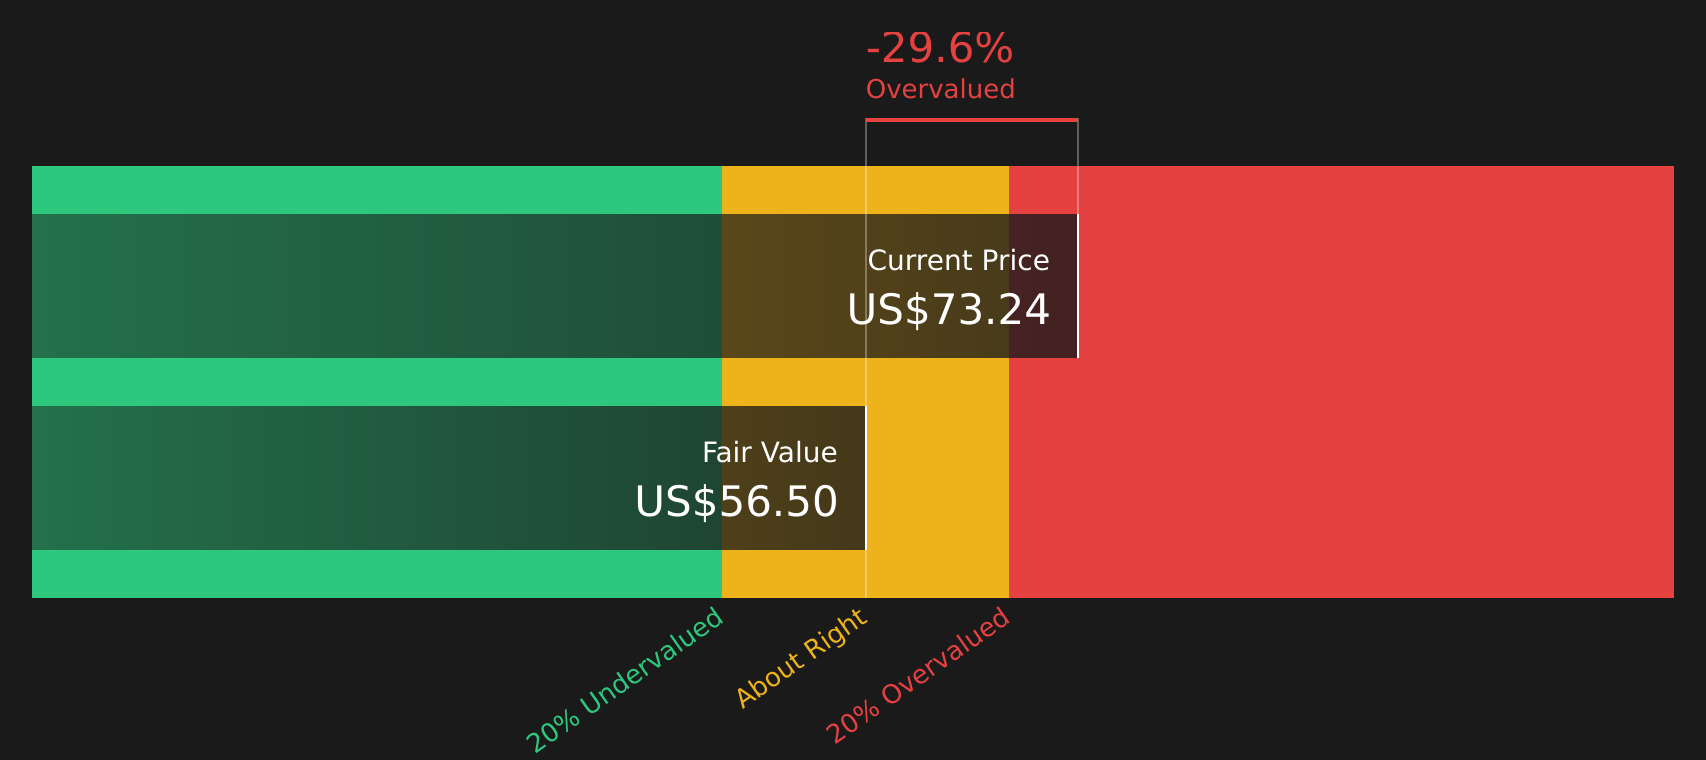
Another angle from our DCF model
The earlier discussion focused on Swarmer’s rich P/B of 36.7x, but the SWS DCF model presents a similar picture. With the stock at $78.52 and our DCF value at $56.40, it screens as overvalued on cash flow assumptions as well. The question is whether you think the story can outrun that gap.
Simply Wall St performs a discounted cash flow (DCF) on every stock in the world every day (check out Swarmer for example). We show the entire calculation in full. You can track the result in your watchlist or portfolio and be alerted when this changes, or use our stock screener to discover 46 high quality undervalued stocks. If you save a screener we even alert you when new companies match - so you never miss a potential opportunity.
Next Steps
The mix of enthusiasm and concern around Swarmer is clear, so it makes sense to check the key numbers yourself and decide how comfortable you are with the balance of risks and rewards. To see both sides clearly, review the 1 key reward and 3 important warning signs
Looking for more investment ideas?
Do not leave your next move to chance. Use data driven stock lists to spot opportunities that match your goals before the market shifts again.
- Target potential value opportunities by reviewing companies flagged in our 46 high quality undervalued stocks.
- Prioritize resilience by scanning companies highlighted in the 63 resilient stocks with low risk scores.
- Hunt for lesser known opportunities by checking the screener containing 22 high quality undiscovered gems.
This article by Simply Wall St is general in nature. We provide commentary based on historical data and analyst forecasts only using an unbiased methodology and our articles are not intended to be financial advice. It does not constitute a recommendation to buy or sell any stock, and does not take account of your objectives, or your financial situation. We aim to bring you long-term focused analysis driven by fundamental data. Note that our analysis may not factor in the latest price-sensitive company announcements or qualitative material. Simply Wall St has no position in any stocks mentioned.