Assessing Teva (TEVA) Valuation As Guidance Driven Momentum Lifts Long Term Profit Expectations
Teva Pharmaceutical Industries Limited Sponsored ADR TEVA | 30.08 | -0.56% |
Guidance driven momentum in Teva shares
Teva Pharmaceutical Industries (TEVA) has been drawing attention after issuing multi year earnings guidance that outlines flat to slightly lower revenues in 2026 alongside higher operating profit, with further profit growth targets through 2030.
The new multi year guidance arrives after a sharp 67.07% 90 day share price return and a 45.30% total shareholder return over the past year, suggesting momentum has been building as investors reassess Teva Pharmaceutical Industries’ profit outlook.
If this earnings guidance has you rethinking opportunities in drug makers, it could be a useful moment to scan other healthcare stocks that might fit a similar thesis or offer a different risk profile.
With TEVA up 67.07% over 90 days and trading at a roughly 45% intrinsic discount and 11.55% below the average analyst price target, you have to ask yourself: is there still value here, or has the market already priced in that long term profit guidance?
Most Popular Narrative: 10.4% Undervalued
With Teva Pharmaceutical Industries’ fair value estimate at $35.32 versus a last close of $31.66, the most followed narrative frames recent strength as only part of the story.
The accelerating launch cadence of biosimilars (with 8 launches targeted through 2027 and a goal to double biosimilar revenue), backed by favorable regulatory trends increasing biosimilar adoption in major markets, is expected to unlock incremental, higher-margin revenue streams and offset headwinds from traditional generics, supporting long-term EBITDA.
Want to see what is behind that higher fair value? The narrative highlights gradual revenue gains, improving margins, and a richer earnings multiple. Curious which assumptions really move the model? The full story joins those dots explicitly.
Result: Fair Value of $35.32 (UNDERVALUED)
However, you still need to weigh up execution risks in the 2026 pipeline, as well as the heavy net debt load of over US$15b that could constrain flexibility.
Another View: Earnings Multiple Flips The Story
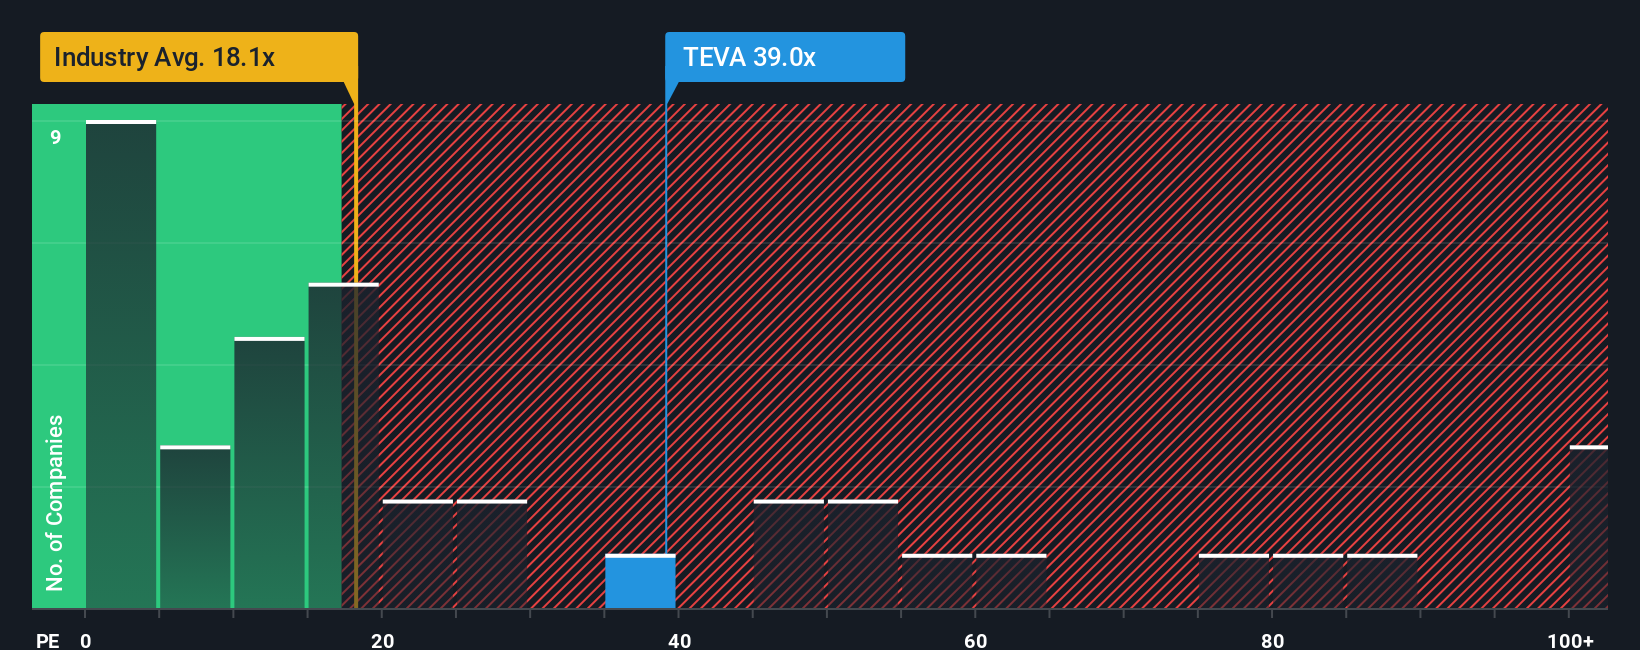
So far, the focus has been on cash flow and fair value, but the current P/E of 50.9x paints a much richer picture. It is well above the US Pharmaceuticals average of 19.6x, the peer average of 19.2x, and even our fair ratio of 25.3x. This raises a simple question: is sentiment running ahead of the fundamentals you are comfortable with?
Build Your Own Teva Pharmaceutical Industries Narrative
If this view does not quite fit how you see Teva Pharmaceutical Industries, or you prefer to test the numbers yourself, you can build a custom narrative in just a few minutes with Do it your way.
A great starting point for your Teva Pharmaceutical Industries research is our analysis highlighting 3 key rewards and 2 important warning signs that could impact your investment decision.
Looking for more investment ideas?
If you stop with just one stock, you could miss other opportunities altogether, so keep pushing your watchlist wider and let fresh ideas challenge your current thinking.
- Spot emerging opportunities early by scanning these 3527 penny stocks with strong financials that pair smaller share prices with solid financial underpinnings.
- Ride the next wave of automation by checking out these 24 AI penny stocks that focus on artificial intelligence themes across different sectors.
- Hunt for mispriced ideas using these 879 undervalued stocks based on cash flows that screen for companies trading below cash flow based estimates.
This article by Simply Wall St is general in nature. We provide commentary based on historical data and analyst forecasts only using an unbiased methodology and our articles are not intended to be financial advice. It does not constitute a recommendation to buy or sell any stock, and does not take account of your objectives, or your financial situation. We aim to bring you long-term focused analysis driven by fundamental data. Note that our analysis may not factor in the latest price-sensitive company announcements or qualitative material. Simply Wall St has no position in any stocks mentioned.