Assessing Toll Brothers (TOL) Valuation After Strong Recent Share Returns
Toll Brothers, Inc. TOL | 140.13 140.13 | -1.28% 0.00% Pre |
Recent share performance and business snapshot
Toll Brothers (TOL) has drawn investor attention after a series of strong recent returns, including about 15% over the past month and roughly 27% in the past 3 months, alongside positive annual revenue and net income growth.
The company reports annual revenue of about US$10.97b and net income of roughly US$1.35b. This reflects its position as a large US luxury homebuilder with operations spanning home construction, community amenities, and related services.
That recent momentum, including a 14.63% 30 day share price return and a 22.53% year to date share price return to US$166.12, sits alongside a 35.52% 1 year total shareholder return and very large 3 and 5 year total shareholder returns, signaling that sentiment has been building over both shorter and longer periods.
If strong housing related names are on your radar, it could also be a good moment to broaden your search with our list of 23 top founder-led companies.
With TOL trading around US$166.12 after strong recent returns and sitting at a premium to its US$155.60 analyst price target, it is worth asking whether there is still a buying opportunity here or whether the market is already pricing in future growth.
Most Popular Narrative: 7.8% Overvalued
With Toll Brothers last closing at $166.12 against a most followed fair value estimate of about $154.13, the leading narrative argues the current price already bakes in optimistic assumptions and then some.
In order for you to agree with the analyst's consensus, you'd need to believe that by 2028, revenues will be $13.1 billion, earnings will come to $1.7 billion, and it would be trading on a PE ratio of 9.6x, assuming you use a discount rate of 8.8%.
Read the complete narrative. Read the complete narrative.
Curious what justifies paying more than the fair value estimate today? The narrative leans on moderate revenue growth, steady margins, and a lower future earnings multiple to keep the math intact.
Result: Fair Value of $154.13 (OVERVALUED)
However, those assumptions could be challenged if Toll Brothers’ heavier use of spec builds forces deeper incentives, or if higher mortgage rates start to cool luxury buyer demand.
Another View: P/E Ratios Paint a Different Picture
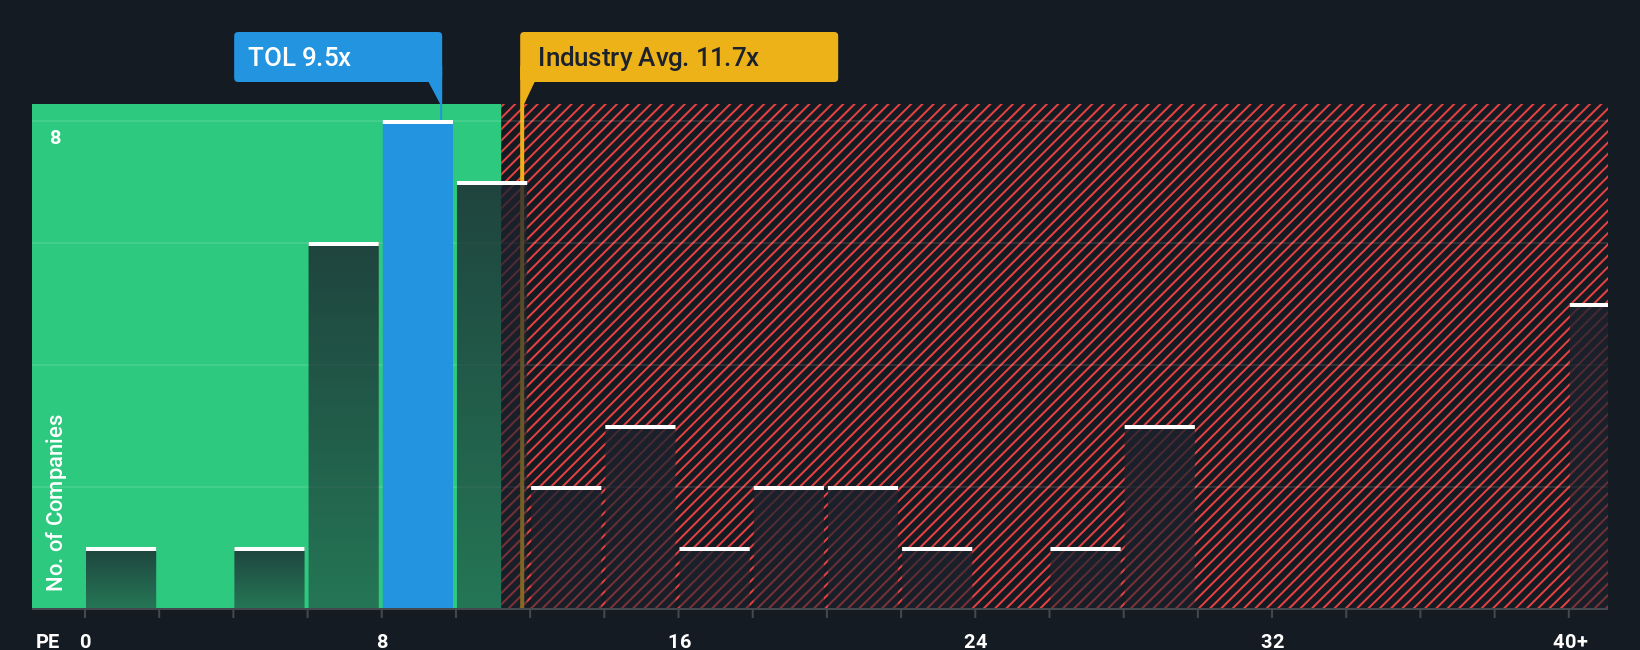
While the SWS model points to Toll Brothers being overvalued versus a $154.13 fair value, the P/E story is less clear cut. At 11.7x earnings, the shares trade below the US Consumer Durables average of 13.6x, below peers at 22.8x, and even under an estimated 16x fair ratio. This raises the question of whether the market is underpricing the earnings stream or instead incorporating expectations of slower growth and margin risks.
Build Your Own Toll Brothers Narrative
If you are not fully on board with these views or prefer to roll up your sleeves and test the numbers yourself, you can build a custom Toll Brothers story in just a few minutes, Do it your way
A good starting point is our analysis highlighting 2 key rewards investors are optimistic about regarding Toll Brothers.
Looking for more investment ideas?
If you want your Toll Brothers research to really count, back it up by scanning a wider set of opportunities that match your goals and risk comfort.
- Target resilient businesses first by checking companies in our 85 resilient stocks with low risk scores that score well on overall risk metrics.
- Hunt for quality at a discount with our list of 53 high quality undervalued stocks that combine solid fundamentals with attractive pricing.
- Spot potential income anchors for your portfolio by reviewing our 13 dividend fortresses offering higher yielding names.
This article by Simply Wall St is general in nature. We provide commentary based on historical data and analyst forecasts only using an unbiased methodology and our articles are not intended to be financial advice. It does not constitute a recommendation to buy or sell any stock, and does not take account of your objectives, or your financial situation. We aim to bring you long-term focused analysis driven by fundamental data. Note that our analysis may not factor in the latest price-sensitive company announcements or qualitative material. Simply Wall St has no position in any stocks mentioned.