Assessing TransUnion (TRU) Valuation After Mixed Recent Share Price Performance
TransUnion TRU | 74.81 | +3.33% |
Why TransUnion Is On Investors’ Radar Today
TransUnion (TRU) is drawing fresh attention as investors weigh its recent share performance against current fundamentals, including annual revenue of US$4.58b and net income of US$455.4m.
With the stock last closing at US$78.31, recent returns over the past month and past 3 months are in focus, alongside multi year total return figures that show a mixed picture.
The recent 9.9% 7 day share price return contrasts with a weaker 90 day share price return of 5.0% decline and a 1 year total shareholder return of 12.3% decline. This suggests momentum has softened after a short burst of strength.
If this mixed performance has you scanning for other opportunities, it could be worth checking our screener of 19 top founder-led companies as a way to spot different kinds of growth stories.
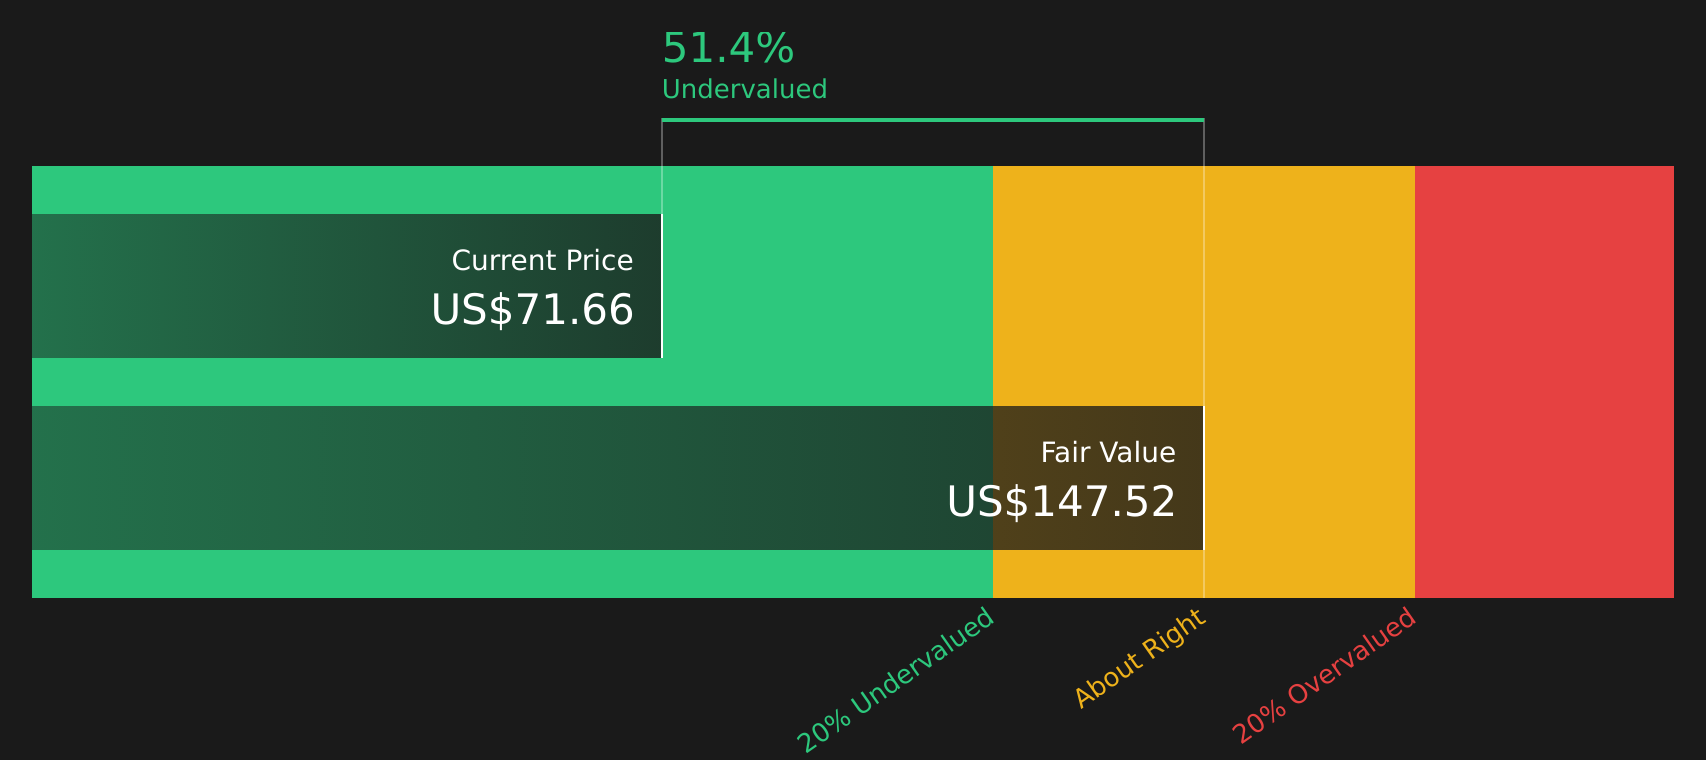
With TransUnion trading at US$78.31 and figures like an estimated intrinsic discount of about 51% and annual revenue of US$4.58b on the table, is there genuine value here, or is the market already baking in future growth?
Most Popular Narrative: 17.4% Undervalued
TransUnion’s most followed narrative pegs fair value around $94.75, compared with the last close of $78.31, which raises clear questions about what is built into those assumptions.
Expansion and success in higher margin, identity/fraud solutions (e.g., Trusted Call Solutions, FactorTrust, TruIQ analytics) are supporting margin accretive revenue streams beyond traditional bureau services, with runway to scale these products globally and into new verticals, likely lifting the company's blended net margins and recurring revenues.
Curious what kind of revenue growth, profit margins, and future earnings multiple are baked into that fair value number, and how long they are assumed to last?
Result: Fair Value of $94.75 (UNDERVALUED)
However, this hinges on data privacy rules and cyber risk staying manageable, as tighter regulation or a major breach could quickly undermine those upbeat assumptions.
Another Angle On Valuation
Our DCF model takes a different tack, suggesting TransUnion could be trading around 51.5% below its estimated future cash flow value of about $161.38 per share, which also implies undervaluation. When earnings multiples and cash flows both lean the same way, do you treat that as confirmation, or as a signal to stress test your own assumptions?
Next Steps
If this mix of upside and concern leaves you on the fence, take a closer look at the full picture and decide quickly where you stand. You can start with 4 key rewards and 1 important warning sign.
Looking for more investment ideas?
If TransUnion has sparked fresh questions, do not stop here. Use the Simply Wall St screener to pressure test your thinking against a wider set of companies.
- Target value opportunities by comparing quality and valuation using our list of 45 high quality undervalued stocks that may warrant a closer look.
- Prioritise resilience by scanning 76 resilient stocks with low risk scores to see which businesses score well on key risk checks before you commit fresh capital.
- Hunt for overlooked stories by reviewing a screener containing 24 high quality undiscovered gems that other investors might be missing right now.
This article by Simply Wall St is general in nature. We provide commentary based on historical data and analyst forecasts only using an unbiased methodology and our articles are not intended to be financial advice. It does not constitute a recommendation to buy or sell any stock, and does not take account of your objectives, or your financial situation. We aim to bring you long-term focused analysis driven by fundamental data. Note that our analysis may not factor in the latest price-sensitive company announcements or qualitative material. Simply Wall St has no position in any stocks mentioned.