Assessing Viavi Solutions (VIAV) Valuation After New XEdge Sensors And AR RF Viewer Launch
Viavi Solutions Inc VIAV | 36.89 | +4.50% |
Viavi Solutions (VIAV) has rolled out new XEdge sensors for private 4G, 5G and Wi-Fi networks alongside an AR-based RF Viewer tool for its OneAdvisor 800 Wireless platform, drawing fresh attention to the stock.
The recent product launches come as Viavi’s share price, now at $18.64, shows building momentum, with a 90 day share price return of 40.89% and a 1 year total shareholder return of 79.06%, while the 5 year total shareholder return of 12.90% points to a more modest longer term record.
If these wireless tools have caught your eye, it could be a good moment to scan other high growth tech and AI names using our high growth tech and AI stocks.
With Viavi now trading at $18.64 and only a small discount to a US$19 analyst price target, plus very strong 1 year and 3 year returns, you have to ask: is there still a buying opportunity here, or is the market already pricing in future growth?
Price-to-Sales of 3.6x: Is it justified?
On P/S, Viavi trades at 3.6x, which sits above both its industry and peer averages, so the current price already bakes in a premium.
The P/S multiple compares the company’s market value to its revenue, which can be useful for businesses where earnings are small or recently turned positive, like Viavi. With Viavi only just back in profit and carrying higher risk funding through external borrowing, a richer P/S asks investors to be comfortable paying up for those revenues.
Against the US Communications industry average of 2x P/S and a peer average of 2.2x, Viavi’s 3.6x mark is materially higher. However, our fair P/S estimate of 5.2x suggests the multiple could shift closer to that level if the market later places more weight on the company’s revenue profile and growth outlook.
Result: Price-to-Sales of 3.6x (OVERVALUED)
However, recent 1 year and 3 year gains already look strong, so any disappointment around revenue of US$1,145.2m or net income of US$15.2m could quickly cool sentiment.
Another View: Our DCF Model Points the Other Way
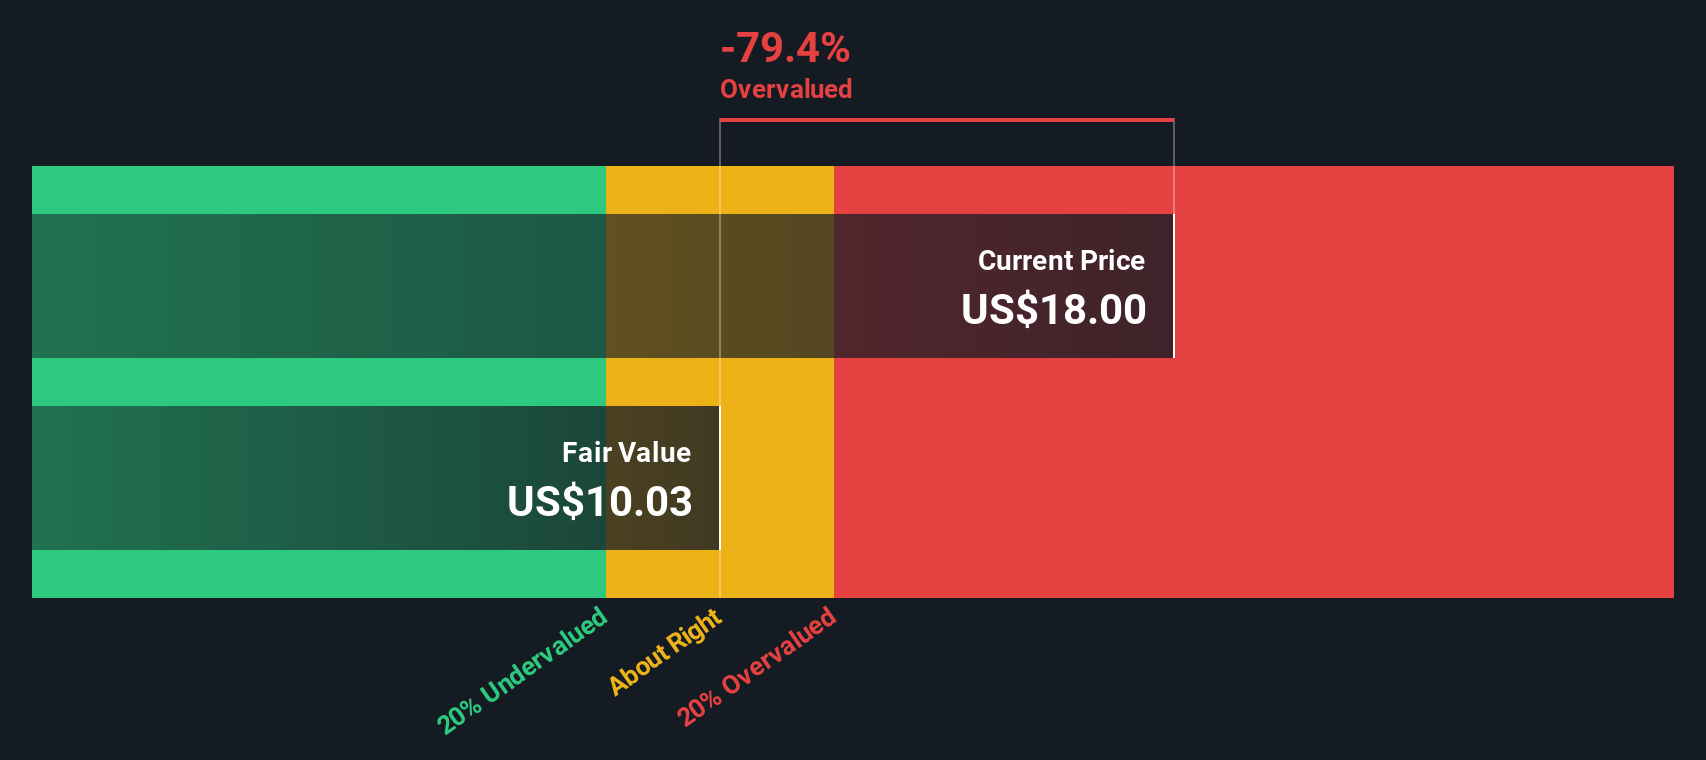
While the P/S of 3.6x looks rich versus peers, our DCF model points in the opposite direction, with an estimated fair value of US$10.01 per share. That implies Viavi at US$18.64 screens as overvalued on this method. Which signal do you give more weight to?
Simply Wall St performs a discounted cash flow (DCF) on every stock in the world every day (check out Viavi Solutions for example). We show the entire calculation in full. You can track the result in your watchlist or portfolio and be alerted when this changes, or use our stock screener to discover 872 undervalued stocks based on their cash flows. If you save a screener we even alert you when new companies match - so you never miss a potential opportunity.
Build Your Own Viavi Solutions Narrative
If you see the numbers differently or prefer to test your own assumptions, you can build a custom view in minutes with Do it your way.
A great starting point for your Viavi Solutions research is our analysis highlighting 2 key rewards and 2 important warning signs that could impact your investment decision.
Ready to widen your watchlist?
If Viavi has sharpened your interest, do not stop here. Take a few minutes to scan other ideas that could fit your style and broaden your options.
- Target potential mispricing by checking these 872 undervalued stocks based on cash flows that may offer more attractive entry points based on cash flows.
- Back bold growth themes by reviewing these 23 AI penny stocks that tap into artificial intelligence across different parts of the market.
- Balance growth with income by screening these 13 dividend stocks with yields > 3% that offer yields above 3% for a steadier return profile.
This article by Simply Wall St is general in nature. We provide commentary based on historical data and analyst forecasts only using an unbiased methodology and our articles are not intended to be financial advice. It does not constitute a recommendation to buy or sell any stock, and does not take account of your objectives, or your financial situation. We aim to bring you long-term focused analysis driven by fundamental data. Note that our analysis may not factor in the latest price-sensitive company announcements or qualitative material. Simply Wall St has no position in any stocks mentioned.