Assessing Whether CME Group (CME) Shares Are Overvalued Or Fairly Priced After Recent Gains
CME Group Inc. Class A CME | 305.11 | +2.75% |
Why CME Group (CME) Is On Investors’ Radar Today
CME Group (CME) has drawn attention after recent share price moves, with the stock last closing at $279.50 and posting positive returns over the past week, month and past 3 months.
Beyond the latest move, CME Group’s year to date share price return of 3.64% and 1 year total shareholder return of 22.39% point to steady momentum. The 5 year total shareholder return of 83.57% underlines how the business has rewarded patient investors.
If CME Group’s recent run has you thinking about what else could be interesting in the market, it might be a good moment to broaden your search with fast growing stocks with high insider ownership.
With CME shares close to analysts’ price target and trading on the back of solid long term returns, the key question now is whether there is still a buying opportunity here or if the market is already pricing in future growth.
Most Popular Narrative: 3.1% Undervalued
With CME Group last closing at $279.50 against a narrative fair value of about $288, the current setup hinges on how future earnings and valuation multiples play out over time.
The analysts have a consensus price target of $282.111 for CME Group based on their expectations of its future earnings growth, profit margins and other risk factors. However, there is a degree of disagreement amongst analysts, with the most bullish reporting a price target of $313.0, and the most bearish reporting a price target of just $212.0.
Curious what justifies pushing earnings higher while also assuming a richer future P/E multiple and only a modest discount rate cut? The full narrative spells out the revenue path, margin profile and valuation bridge that need to line up for today’s price to converge with that fair value.
The most followed narrative builds its $288.33 fair value estimate by blending moderate revenue growth, relatively high profit margins and a future earnings multiple that sits above the current sector level.
It uses an 8.15% discount rate to bring those projected cash flows and earnings back to today, which keeps the model grounded in a required return that many investors would view as reasonable for a large, established exchange operator.
Taken together, the result is only a small gap between fair value and the latest share price. As a result, a lot rests on whether CME Group can deliver on those earnings and sustain that higher future P/E.
Result: Fair Value of $288.33 (ABOUT RIGHT)
However, this hinges on trading activity holding up, and any shift toward decentralized or lower fee venues could challenge CME Group’s transaction-driven revenue model.
Another Angle On Valuation
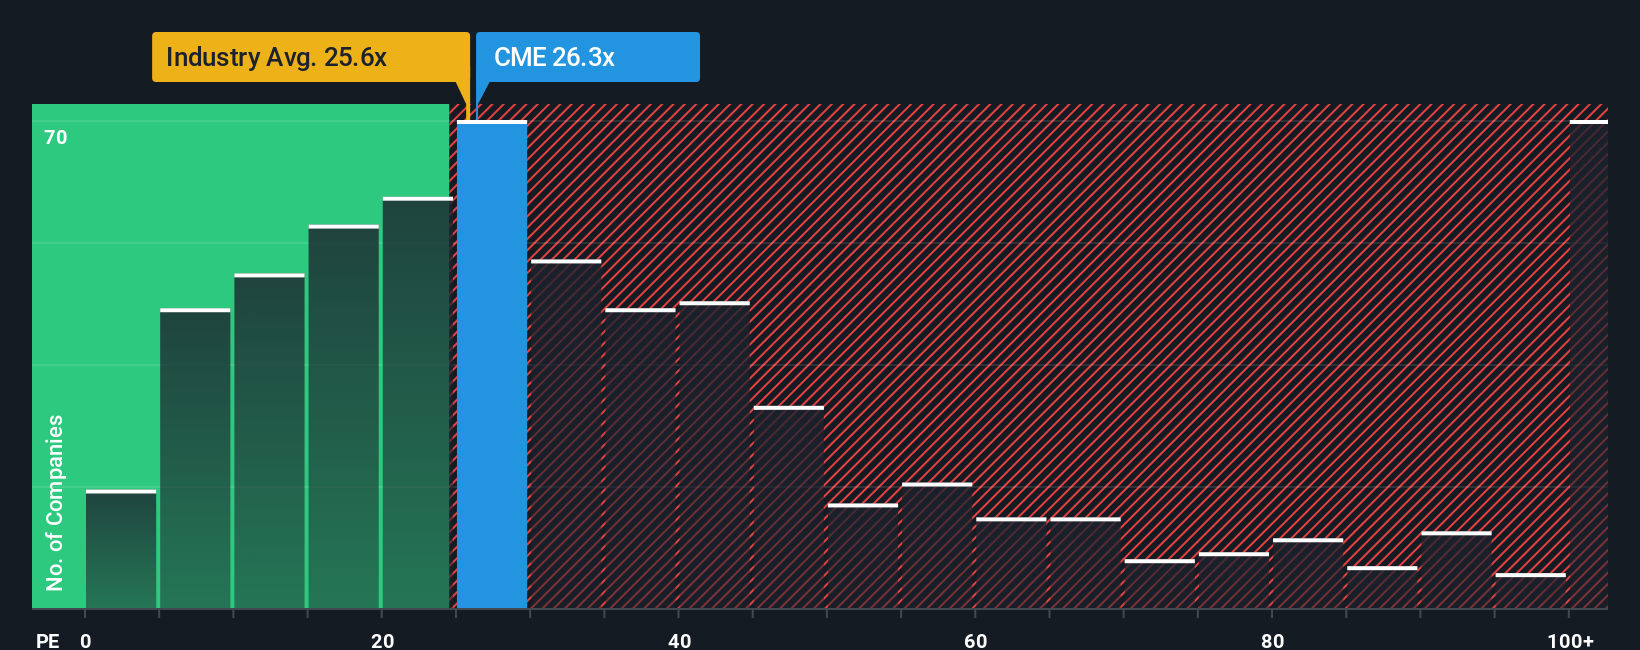
The narrative fair value of about US$288 per share suggests CME Group is only slightly undervalued, but the market is telling a sharper story. At a P/E of 27.1x versus a fair ratio of 15.9x, the shares look expensive. Which signal do you trust more?
Build Your Own CME Group Narrative
If you look at the numbers and reach a different conclusion, or simply prefer to test your own assumptions, you can build a full narrative yourself in just a few minutes with Do it your way.
A great starting point for your CME Group research is our analysis highlighting 1 key reward and 2 important warning signs that could impact your investment decision.
Looking for more investment ideas?
If CME Group is already on your watchlist, do not stop there. Use the Simply Wall St Screener to spot other opportunities that could fit your style.
- Zero in on potential value candidates by checking out these 863 undervalued stocks based on cash flows where the current share prices sit below estimated cash flow based fair values.
- Position yourself early in emerging themes by scanning these 24 AI penny stocks for companies tied to artificial intelligence with focused business models.
- Strengthen your income watchlist by reviewing these 12 dividend stocks with yields > 3% that offer yields above 3% along with supporting fundamentals.
This article by Simply Wall St is general in nature. We provide commentary based on historical data and analyst forecasts only using an unbiased methodology and our articles are not intended to be financial advice. It does not constitute a recommendation to buy or sell any stock, and does not take account of your objectives, or your financial situation. We aim to bring you long-term focused analysis driven by fundamental data. Note that our analysis may not factor in the latest price-sensitive company announcements or qualitative material. Simply Wall St has no position in any stocks mentioned.