Assessing Whether PayPay (PAYP) Looks Undervalued After Recent Share Price Weakness
PayPay Corporation Sponsored ADR PAYP | 0.00 |
Recent price moves and what they might signal
PayPay (PAYP) has seen its share price fall 7.7% today, extending a decline of about 20% over the past week and 26% over the past month, putting recent performance firmly in focus for investors.
The recent drop sits within a wider loss of momentum, with the share price return year to date down 13.33%, suggesting investors are reassessing both PayPay’s growth profile and the risks they are prepared to accept at the current US$15.74 price.
If PayPay’s swings have you thinking about where else capital could go to work, it may be a good time to scan for other opportunities through 21 top founder-led companies
With PayPay trading at US$15.74, alongside analyst targets around US$25.08 and valuation models that imply a smaller discount, the key question is simple: is this a genuine mispricing or is the market already baking in future growth?
Price-to-Earnings of 14.8x: Is it justified?
On a P/E of 14.8x, PayPay is priced below both its peer group average of 20.3x and the wider US diversified financials average of 16.4x, which points to a discount at the current $15.74 share price.
The P/E multiple compares what you pay today for each dollar of current earnings, so a lower figure than peers can imply the market is pricing in more modest expectations or is being cautious. For PayPay, that sits alongside earnings growth that is forecast at 10.48% per year, with revenue growth expected at 14.2% per year, and net profit margins currently around 30.5%.
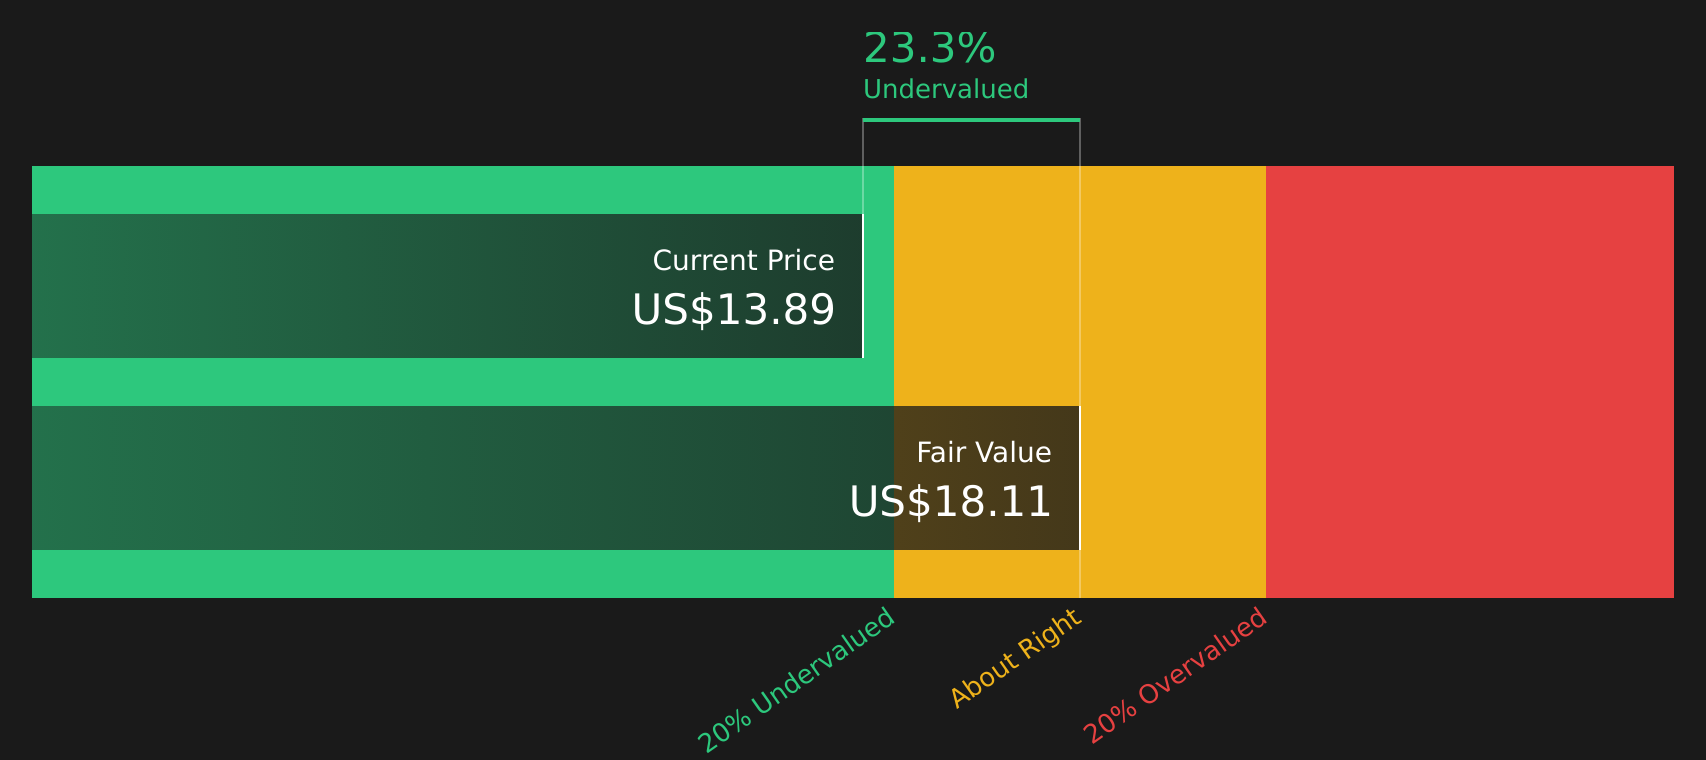
Set against that, the stock is also assessed as trading at 12.1% below an SWS DCF fair value estimate of $17.91, and analysts are in good agreement on a higher price target around $25.08. Taken together, the combination of a below peer P/E, a discount to a published cash flow value, and ongoing forecast earnings growth suggests the market is not paying up aggressively for those forecasts at this point.
Compared with the US diversified financials P/E average of 16.4x, PayPay's 14.8x multiple is meaningfully lower, suggesting the stock is valued more conservatively than many sector peers even though its recent earnings growth rate over the past year has been much stronger than the broader industry figure of 8.6%.
Result: Price-to-Earnings of 14.8x (UNDERVALUED)
However, the story can change quickly if competition in Japanese digital finance heats up or if growth in PayPay’s payment and financial services slows.
Wall Street's queuing for one rocket. While SpaceX counts down to its IPO, other companies tied to the new space race are already in orbit. → 20 Compelling Space Companies watchlist · Global Space Race Investing Ideas screener · Scan the sector by valuation on Rocket Lab's valuation page.
Another view: our DCF model
The P/E points to PayPay looking inexpensive, but our DCF model is more restrained, suggesting the stock is trading about 12.1% below an estimated fair value of $17.91. That still leans toward undervalued, but the gap is narrower. How much of a margin of safety do you really have?
Simply Wall St performs a discounted cash flow (DCF) on every stock in the world every day (check out PayPay for example). We show the entire calculation in full. You can track the result in your watchlist or portfolio and be alerted when this changes, or use our stock screener to discover 47 high quality undervalued stocks. If you save a screener we even alert you when new companies match - so you never miss a potential opportunity.
Next Steps
With the mixed signals around price, growth forecasts, and valuation, it makes sense to look at the underlying data yourself and move promptly while the picture is clear, starting with the 4 key rewards and 2 important warning signs
Looking for more investment ideas?
If PayPay has sharpened your focus, do not stop here. Use the screener to uncover other stocks that fit your goals before the market moves on.
- Target steadier opportunities by scanning 64 resilient stocks with low risk scores to aim to keep volatility in check while still allowing room for returns.
- Hunt for value by reviewing 47 high quality undervalued stocks where strong fundamentals may not yet be fully reflected in current prices.
- Spot potential future standouts through screener containing 22 high quality undiscovered gems that combine quality metrics with relatively limited market attention.
This article by Simply Wall St is general in nature. We provide commentary based on historical data and analyst forecasts only using an unbiased methodology and our articles are not intended to be financial advice. It does not constitute a recommendation to buy or sell any stock, and does not take account of your objectives, or your financial situation. We aim to bring you long-term focused analysis driven by fundamental data. Note that our analysis may not factor in the latest price-sensitive company announcements or qualitative material. Simply Wall St has no position in any stocks mentioned.