

Avista (AVA) Stock Looks Rich On Dividends And Reasonable On Earnings
Avista Corporation AVA | 0.00 |
Avista stock has delivered a 25.7% total return over the past three years. At around US$41.82, the Dividend Discount Model (DDM) currently points to a premium to its intrinsic value, while the market multiples look roughly in line with peers. This leaves investors to judge whether the recent gains still leave a comfortable margin of safety.
- Over the past three years Avista has returned 25.7%, which suggests investors have already been rewarded and raises the bar for any further upside to be supported by fundamentals.
- The ability to grow and sustain dividend payments can support the valuation. At the same time, exposure to regulated returns and capital intensive infrastructure projects may limit flexibility if funding conditions or allowed returns become less favorable.
- Avista scores 3 out of 6 on the broader valuation checks, which points to a mixed picture rather than a clear bargain or clear overvaluation.
The issue now is whether Avista's current price, given its recent returns and the DDM premium signal, leaves enough valuation upside to justify new capital going into the stock.
Does Avista Look Pricey on Dividends?
The Dividend Discount Model (DDM) values Avista by projecting future dividend growth and discounting those payments back to today. For Avista, the model uses an annual dividend per share of about $2.10, an estimated return on equity of 7.27% and an 82.46% payout ratio, which implies a modest dividend growth rate of roughly 1.28% a year. That combination suggests a mature utility business where most earnings are returned to shareholders rather than reinvested for rapid expansion.
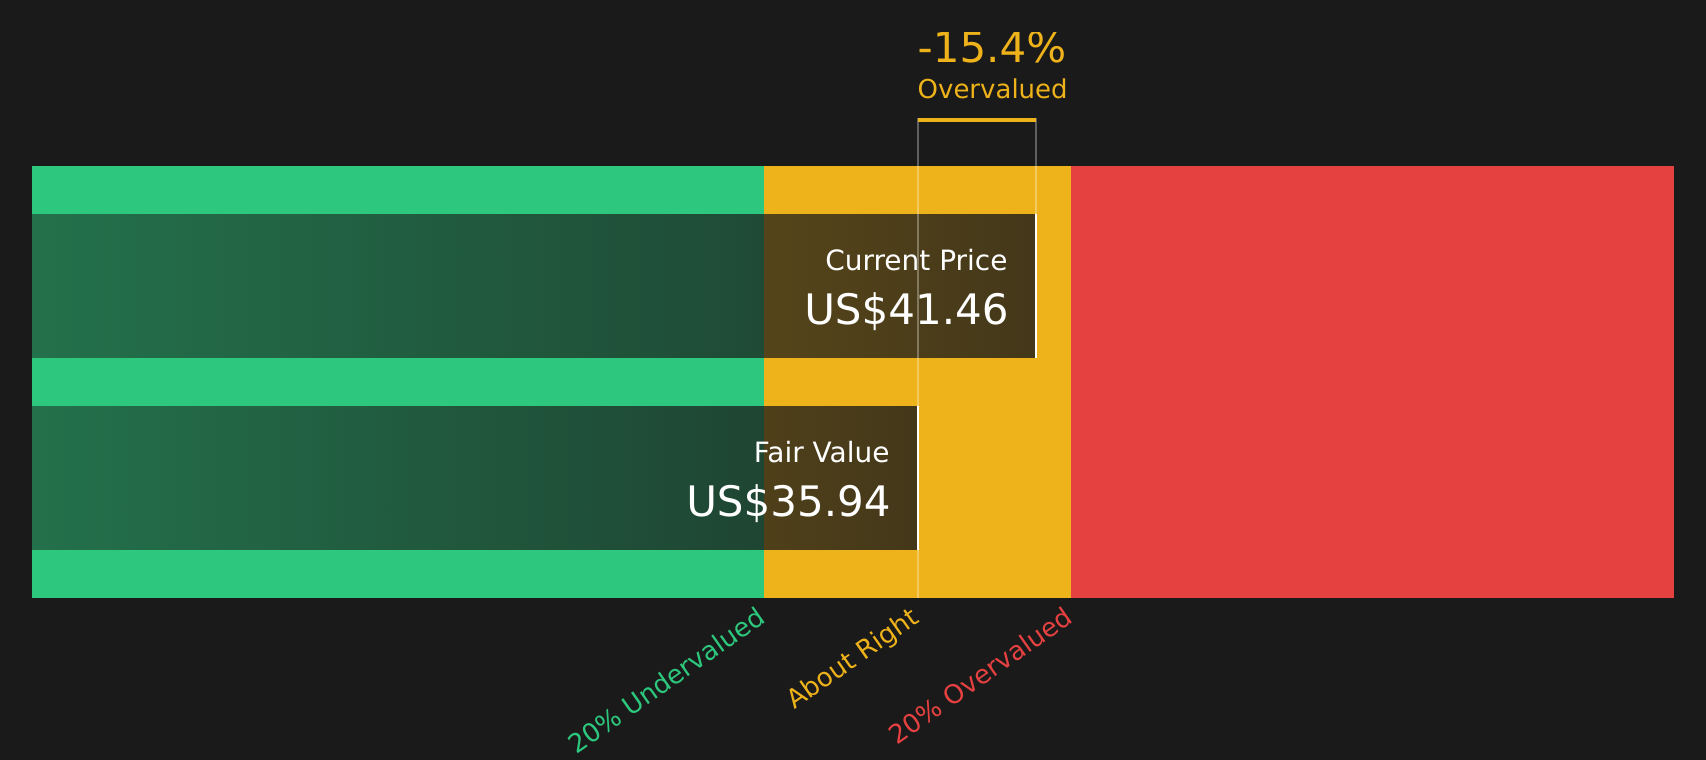
On these assumptions, the DDM indicates an intrinsic value of about $35.94 per share, compared with the current share price around $41.82. That gap points to Avista stock trading at a premium of roughly 16.4%, with the implied growth in the model already relatively low. For income focused investors, the key question is whether the current yield and the potential for gradual dividend increases justify paying above the model’s estimate of intrinsic value.
On this DDM view, Avista stock currently screens as overvalued relative to its projected stream of dividends.
Our Dividend Discount Model (DDM) analysis suggests Avista may be overvalued by 16.4%. Discover 44 high quality undervalued stocks or create your own screener to find better value opportunities.
Does Avista Look Fairly Valued on Earnings?
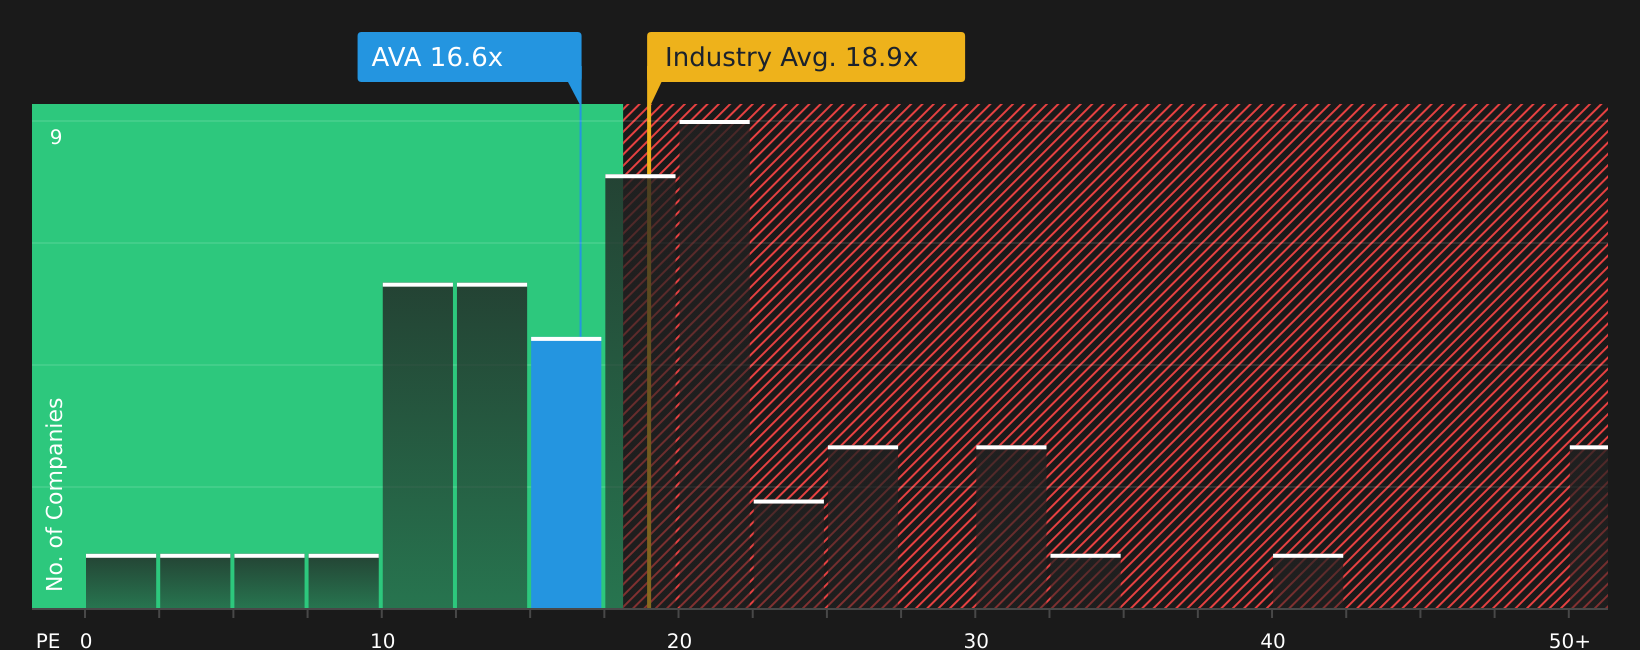
The P/E ratio fits Avista well because earnings and dividends are central to how investors usually look at regulated utilities. Avista currently trades on a P/E of about 16.8x, compared with an Integrated Utilities industry average of roughly 19.2x and a peer group average closer to 30.4x. That places the stock at a discount to both its industry and the broader peer set on earnings.
The tailored fair P/E for Avista is estimated at around 17.7x, only slightly above the current multiple. That narrow gap suggests the market price already lines up closely with what might be expected given Avista’s profile, including its regulation, capital intensity and measured dividend growth assumptions. For investors, the P/E does not indicate an obvious bargain or a clear stretch, but instead points to Avista stock being reasonably aligned with its fundamentals on this metric.
On the P/E multiple, Avista currently appears roughly fairly valued rather than clearly cheap or expensive.
The Avista Narrative: What Would Justify Today's Price?
Simply Wall St Narratives pick up where Avista's valuation puzzle leaves off by spelling out which assumptions about its future growth, margins and earnings would need to play out for the stock to be worth materially more or less than today's price. Each narrative ties a fair value estimate to a clear story about Avista's potential catalysts and risks, so you can track over time which version of events appears to be unfolding on the Community page.
If you have a clear, number driven view on where Avista's growth, margins and execution go from here, this is a chance to add your voice to the Simply Wall St community and set out that case.
Share your own narrative on Avista, then track over time how your thesis holds up as new data and company results come through.
Do you think there's more to the story for Avista? Head over to our Community to see what others are saying!
The Bottom Line
For Avista, the Dividend Discount Model (DDM) points to the stock trading above its intrinsic value estimate, while the P/E view suggests pricing that is broadly in line with comparable utilities. That split reflects the tension between a richer price for the current dividend stream and a market that still treats Avista as a steady, regulated earner. The crux for investors is whether future dividend growth and allowed returns on its capital intensive projects prove solid enough to keep justifying a premium to the intrinsic value signal.
This article by Simply Wall St is general in nature. We provide commentary based on historical data and analyst forecasts only using an unbiased methodology and our articles are not intended to be financial advice. It does not constitute a recommendation to buy or sell any stock, and does not take account of your objectives, or your financial situation. We aim to bring you long-term focused analysis driven by fundamental data. Note that our analysis may not factor in the latest price-sensitive company announcements or qualitative material. Simply Wall St has no position in any stocks mentioned.