Axon Enterprise (AXON) Valuation Check As Earnings Loom With EPS Pressure And Strong Revenue Growth
Axovant Sciences Ltd AXON | 412.81 | -2.54% |
Axon Enterprise (AXON) is approaching its February 24, 2026 earnings release, with investors watching how a projected near 20% EPS decline compares with revenue growth that is expected to exceed 30%.
At a share price of $434.45, Axon Enterprise has seen a 31.23% 1 month share price decline and a 22.89% year to date pullback, while its 3 year total shareholder return of 118.33% and 5 year total shareholder return of 143.55% show that longer term holders have still seen strong gains. This suggests recent momentum has cooled as investors weigh earnings risks against earlier growth enthusiasm and news around international rollouts and capital structure simplification.
If Axon’s recent swings have you rethinking concentration risk, this could be a good moment to widen your watchlist with our screener of 22 top founder-led companies.
So with earnings coming up, a projected near 20% EPS drop, revenue growth above 30%, and the share price well below analyst targets, is Axon now on sale, or is the market already pricing in its future growth?
Most Popular Narrative: 46.7% Undervalued
Compared with Axon Enterprise’s last close at $434.45, the most widely followed narrative pegs fair value at $815. This highlights a wide gap that hinges on aggressive long term assumptions and a relatively low discount rate of 7.64%.
Fast-track adoption of new Axon products such as Draft One (AI), TASER 10, Axon Body 4, and Dedrone (counter-drone) is driving up average deal values and product bundles per customer, raising net revenue per user and supporting higher long-term margins as the ecosystem deepens.
Curious what kind of revenue growth, margin profile, and future earnings multiple need to hold for that fair value to stack up? The narrative leans on strong recurring revenue assumptions, a sizable upgrade cycle, and a premium earnings valuation usually reserved for fast growing software names. The full story is in how those moving parts work together over the next few years, not just today’s share price.
Result: Fair Value of $815 (UNDERVALUED)
However, if government budgets tighten or privacy rules restrict adoption of Axon’s AI and surveillance tools, the high growth narrative could look far more fragile.
Another View: High P/E Puts Pressure On The Story
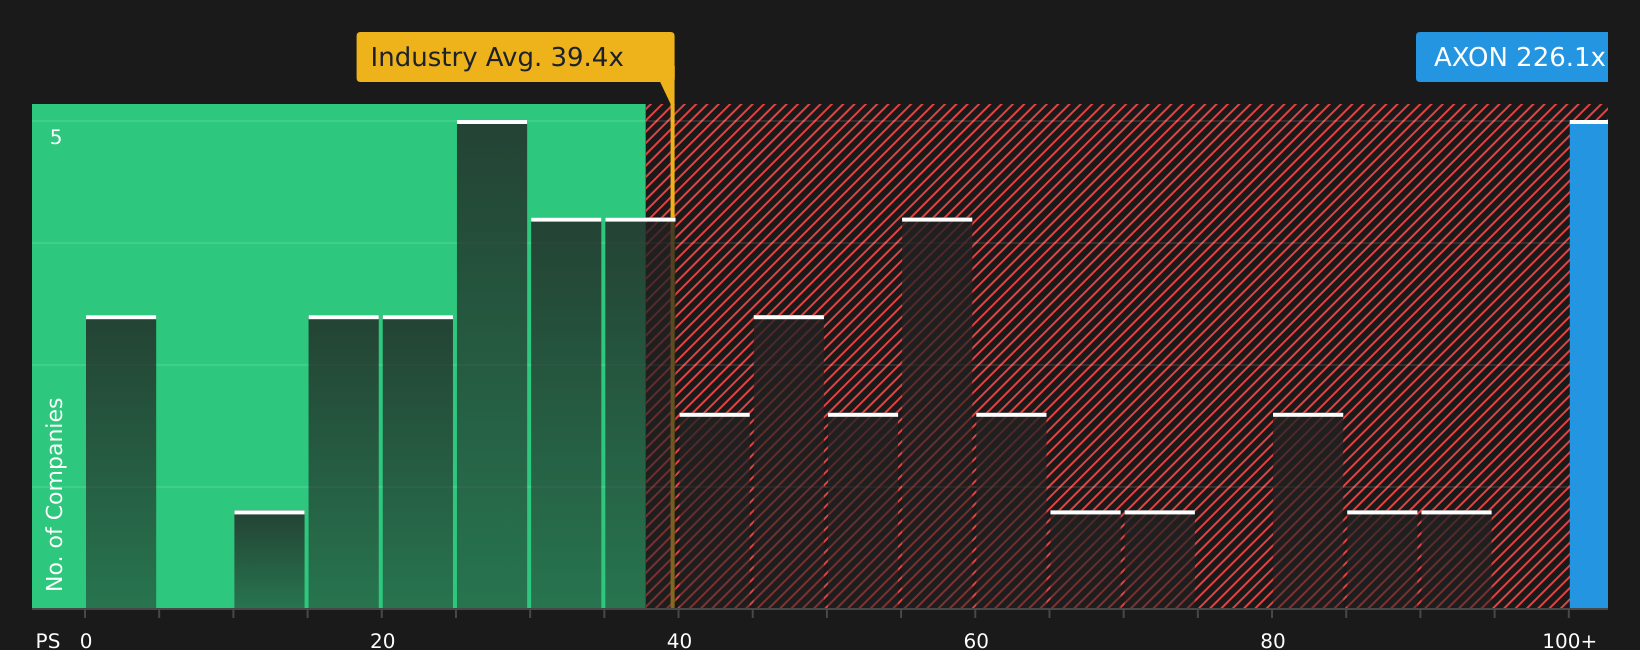
While the narrative-based fair value points to Axon Enterprise as undervalued, the current P/E of 134.2x is far higher than the US Aerospace & Defense average of 41.9x, the peer average of 55.5x, and even a fair ratio of 48.4x. This implies meaningful valuation risk if expectations cool.
That kind of gap can close in two ways: either earnings catch up, or the share price does the heavy lifting in reverse. Which outcome do you think is more realistic for your time horizon?
Build Your Own Axon Enterprise Narrative
If you see the numbers differently or want to stress test your own assumptions, you can spin up a custom Axon view in just a few minutes: Do it your way.
A great starting point for your Axon Enterprise research is our analysis highlighting 3 key rewards and 3 important warning signs that could impact your investment decision.
Looking for more investment ideas?
If Axon has sharpened your thinking, do not stop here. Broaden your opportunity set with a few focused screens that keep you in control of your choices.
- Target quality at a discount by checking companies our screener flags as 51 high quality undervalued stocks with stronger fundamentals than their prices suggest.
- Prioritise resilience and capital strength with stocks in our solid balance sheet and fundamentals stocks screener (45 results) that may better handle shocks and funding needs.
- Lock in potential income ideas by reviewing companies in our 13 dividend fortresses that offer yields many investors are actively seeking.
This article by Simply Wall St is general in nature. We provide commentary based on historical data and analyst forecasts only using an unbiased methodology and our articles are not intended to be financial advice. It does not constitute a recommendation to buy or sell any stock, and does not take account of your objectives, or your financial situation. We aim to bring you long-term focused analysis driven by fundamental data. Note that our analysis may not factor in the latest price-sensitive company announcements or qualitative material. Simply Wall St has no position in any stocks mentioned.