

Banner (BANR) Stock Looks Cheap On Fair Value Yet Full On Earnings
Banner Corporation BANR | 0.00 |
Banner stock has delivered a strong 85.0% return over the past three years, and the current Excess Returns intrinsic value estimate still points to the shares trading at a sizeable discount to that assessment. At the same time, traditional market multiples suggest the pricing is about right, which puts extra focus on how investors read the recent move and the new buyback plan.
- Over the last three years, Banner has returned 85.0%. This places more weight on whether the current price already reflects the company’s recent progress.
- The newly announced authorization to repurchase up to 1.7 million shares can support per share value. The key risk is that future earnings or asset quality trends may not justify continued capital returns at this pace.
- Banner scores a high valuation rating, with the broader checks pointing to an undervalued profile in 5 of 6 tests.
The stock’s next move may depend on whether the current price near US$74.01 already captures that 38.0% Excess Returns upside or still leaves a meaningful margin of safety.
Is Banner Still Cheap on Excess Returns?
The Excess Returns model estimates what Banner can earn above its cost of equity based on future return on equity and book value per share. For Banner, the inputs indicate a business that is projected to earn more on its equity base than investors are charging for that capital.
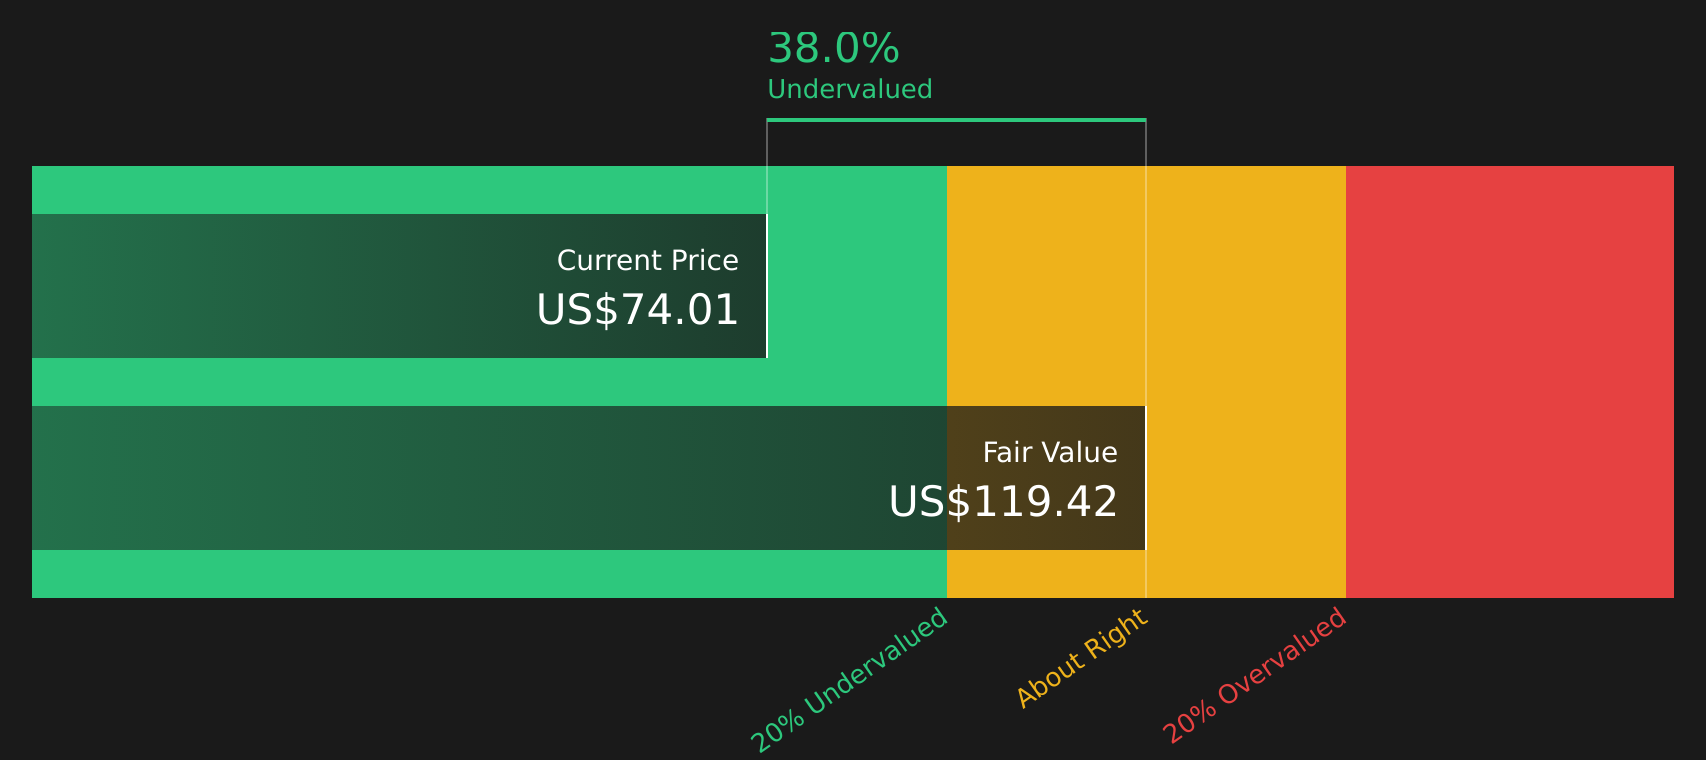
The model uses a book value of $58.83 per share and a stable EPS of $6.58 per share, with both figures grounded in analyst forecasts for future returns. Compared with a cost of equity of $4.62 per share, this implies an excess return of $1.97 per share on an average return on equity of 10.31%. That return profile, together with a stable book value of $63.84 per share, produces an Excess Returns intrinsic value estimate of $119.42 per share, relative to the current price near $74.01. Because the board has approved a program to repurchase up to 1.7 million shares, the market reaction to date still leaves the stock trading well below the value indicated by this model.
On this Excess Returns view, Banner stock currently appears undervalued.
Our Excess Returns analysis suggests Banner is undervalued by 38.0%. Track this in your watchlist or portfolio, or discover 50 more high quality undervalued stocks.
Where Does Banner Sit on Earnings?
The P/E ratio suits Banner because earnings are a core anchor for how investors usually value banks. On this measure, Banner trades on about 12.1x earnings, which is very close to the Banks industry average of roughly 12.1x and only slightly below the peer group at about 12.9x. That places the stock in the middle of the pack rather than as a clear outlier on price versus earnings.
The Fair P/E Ratio for Banner is estimated at about 13.0x, which is the multiple you might expect given its earnings profile, size and sector risk. The current 12.1x level sits just under that mark, so the gap is small and not enough on its own to point to a clear discount or premium. Taken together with the broader valuation work, the market-multiple view suggests the current price for Banner is broadly in line with what earnings would justify.
On the P/E yardstick, Banner stock appears roughly fairly valued at current levels.

The Banner Narrative: What Would Justify Today's Price?
Simply Wall St Narratives for Banner aim to connect the earlier valuation puzzle with clear, testable storylines about what might need to happen next for earnings and returns to justify a higher or lower share price. Each one links its number to a specific view on how Banner's growth, margins and risk profile could evolve, which you can refer back to as fresh results and new information come through over time.
You can be one of the first voices in the Simply Wall St community to set out a clear, number driven narrative on Banner that others can track over time.
Share a view on whether Banner's new authorization to repurchase up to 1.7 million shares delivers the kind of value per share that current valuation metrics and the Excess Returns model suggest might be possible.
Do you think there's more to the story for Banner? Head over to our Community to see what others are saying!
The Bottom Line
For Banner, the Excess Returns intrinsic value estimate still points to material upside, while the P/E view suggests the stock trades close to what comparable banks justify today. The high value score and intrinsic value signal lean towards undervalued, yet the market seems cautious and is not granting a clear re-rating. From here, what matters most is whether Banner can sustain the earnings and return profile that underpins that Excess Returns estimate, particularly as the new buyback runs. If that holds, current pricing may look conservative. However, if earnings or asset quality soften, the current multiple could prove more realistic than the intrinsic value figure.
This article by Simply Wall St is general in nature. We provide commentary based on historical data and analyst forecasts only using an unbiased methodology and our articles are not intended to be financial advice. It does not constitute a recommendation to buy or sell any stock, and does not take account of your objectives, or your financial situation. We aim to bring you long-term focused analysis driven by fundamental data. Note that our analysis may not factor in the latest price-sensitive company announcements or qualitative material. Simply Wall St has no position in any stocks mentioned.