Barrick Mining (B) Slides As Investors Ask If The Value Case Still Holds
Barrick Mining B | 0.00 |
Recent Performance Snapshot for Barrick Mining
Barrick Mining (B) has drawn attention after its share price closed at US$36.73, with the stock down about 14% over the past month and about 13% over the past 3 months.
Over a longer horizon, Barrick Mining shows a 1 year total return of about 80%, alongside reported annual revenue of US$19,044 and net income of US$6,121. This combination gives investors a mix of recent pressure and stronger multi year performance.
Barrick Mining’s recent share price drift, with a year to date share price return down 16.67% and a 30 day share price return down 13.68%, contrasts with its 1 year total shareholder return of 80.19%. This suggests earlier strong gains are now consolidating as investors reassess growth potential and risk.
If you are comparing Barrick Mining with other gold producers, this is a good moment to scan opportunities across the sector using the 33 elite gold producer stocks
The mixed picture for Barrick Mining, with recent share price weakness alongside a 1 year total return of about 80% and a slight intrinsic discount, raises a key question for you: is this a fresh buying opportunity, or is the market already pricing in future growth?
Preferred Price-to-Earnings of 10.1x: Is it justified?
On recent numbers, Barrick Mining trades on a P/E of 10.1x, which screens as inexpensive relative to both its peers and the wider US Metals and Mining industry.
The P/E ratio links Barrick Mining’s current share price of $36.73 to its earnings per share. This gives a quick sense of how much investors are paying for each dollar of profit. For a company producing gold, copper, silver and other materials, earnings are a key reference point because cash flows can be influenced by commodity prices and production volumes.
According to the checks provided, Barrick Mining is viewed as good value on this measure, with its 10.1x P/E sitting below the peer average of 16.2x and the US Metals and Mining industry average of 20.9x. The internal fair P/E estimate of 24.7x is also well above the current multiple. This points to a large gap between what the SWS fair ratio model suggests and where the market is currently pricing the stock.
Result: Price-to-Earnings of 10.1x (UNDERVALUED)
However, Barrick Mining’s appeal could be tested if commodity prices soften or if key operations such as Carlin or Cortez face production or cost setbacks.
Another View on Barrick Mining’s Value
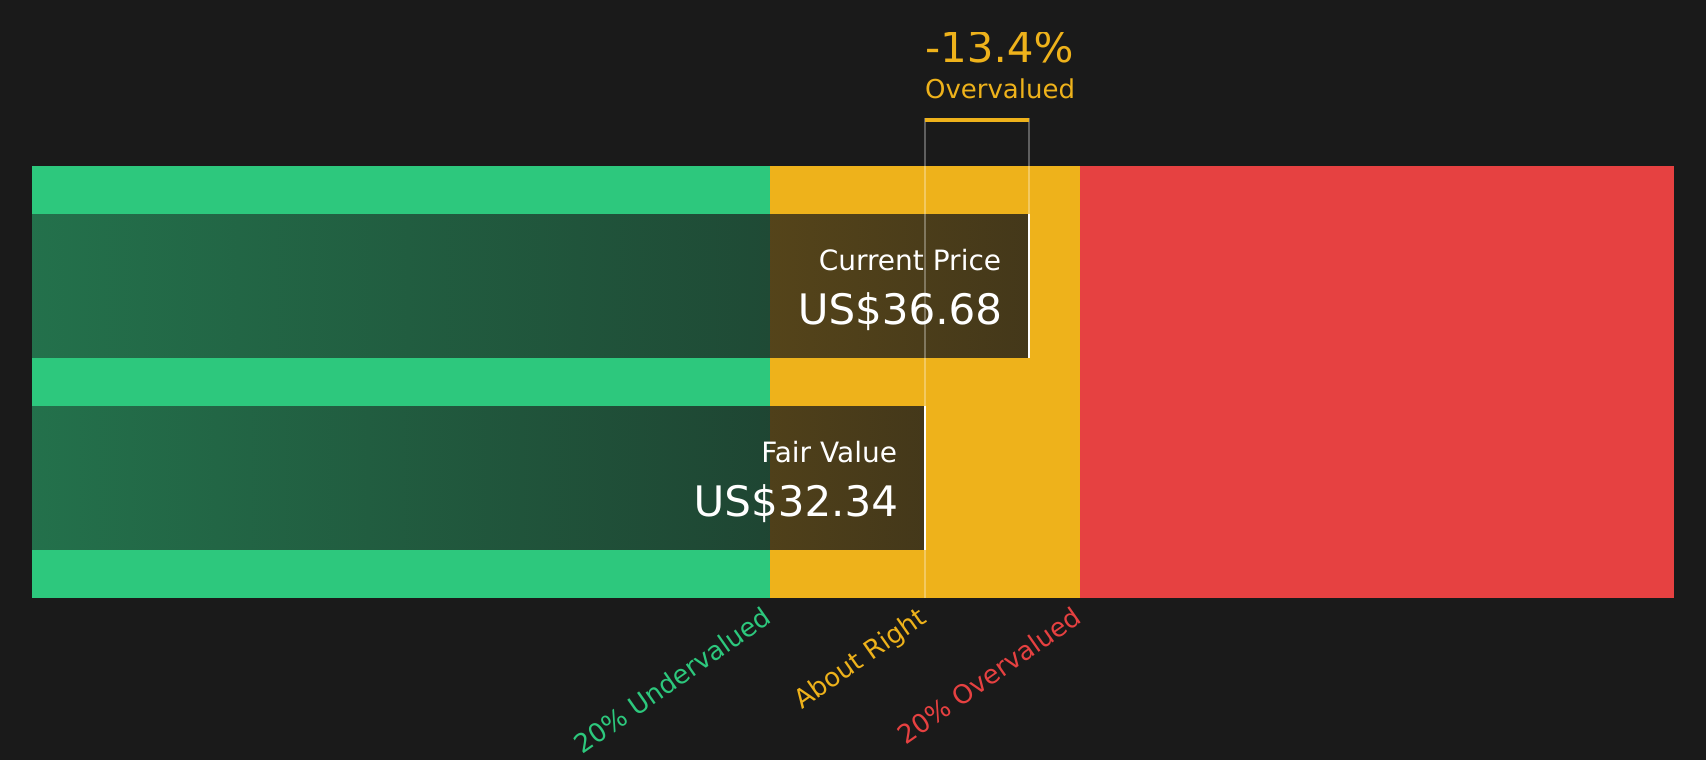
While Barrick Mining looks inexpensive on a 10.1x P/E, the SWS DCF model points to a fair value of about $37.32 per share versus the current $36.73. That is only a 1.6% discount, which is quite small. Is this really a clear bargain or just a slight mispricing?
Simply Wall St performs a discounted cash flow (DCF) on every stock in the world every day (check out Barrick Mining for example). We show the entire calculation in full. You can track the result in your watchlist or portfolio and be alerted when this changes, or use our stock screener to discover 43 high quality undervalued stocks. If you save a screener we even alert you when new companies match - so you never miss a potential opportunity.
Next Steps
With Barrick Mining presenting both pressure and promise, this is a moment to look closely at the underlying data and decide how it fits your approach, then weigh both sides of the story with the 4 key rewards and 1 important warning sign.
Looking for more investment ideas beyond Barrick Mining?
Do not stop with Barrick Mining. Broaden your watchlist with stocks that fit different return profiles so you are not relying on a single type of opportunity.
- Target potential mispricings by scanning companies that combine quality and value using the 43 high quality undervalued stocks.
- Strengthen your income stream by reviewing stocks that offer robust payouts and yield support through the 10 dividend fortresses.
- Protect your downside by focusing on companies with steadier risk profiles via the 74 resilient stocks with low risk scores.
This article by Simply Wall St is general in nature. We provide commentary based on historical data and analyst forecasts only using an unbiased methodology and our articles are not intended to be financial advice. It does not constitute a recommendation to buy or sell any stock, and does not take account of your objectives, or your financial situation. We aim to bring you long-term focused analysis driven by fundamental data. Note that our analysis may not factor in the latest price-sensitive company announcements or qualitative material. Simply Wall St has no position in any stocks mentioned.