Belden (BDC): Margin Stability Reinforces Value Narrative Despite Slower Earnings Growth vs. Market
Belden Inc. BDC | 0.00 |
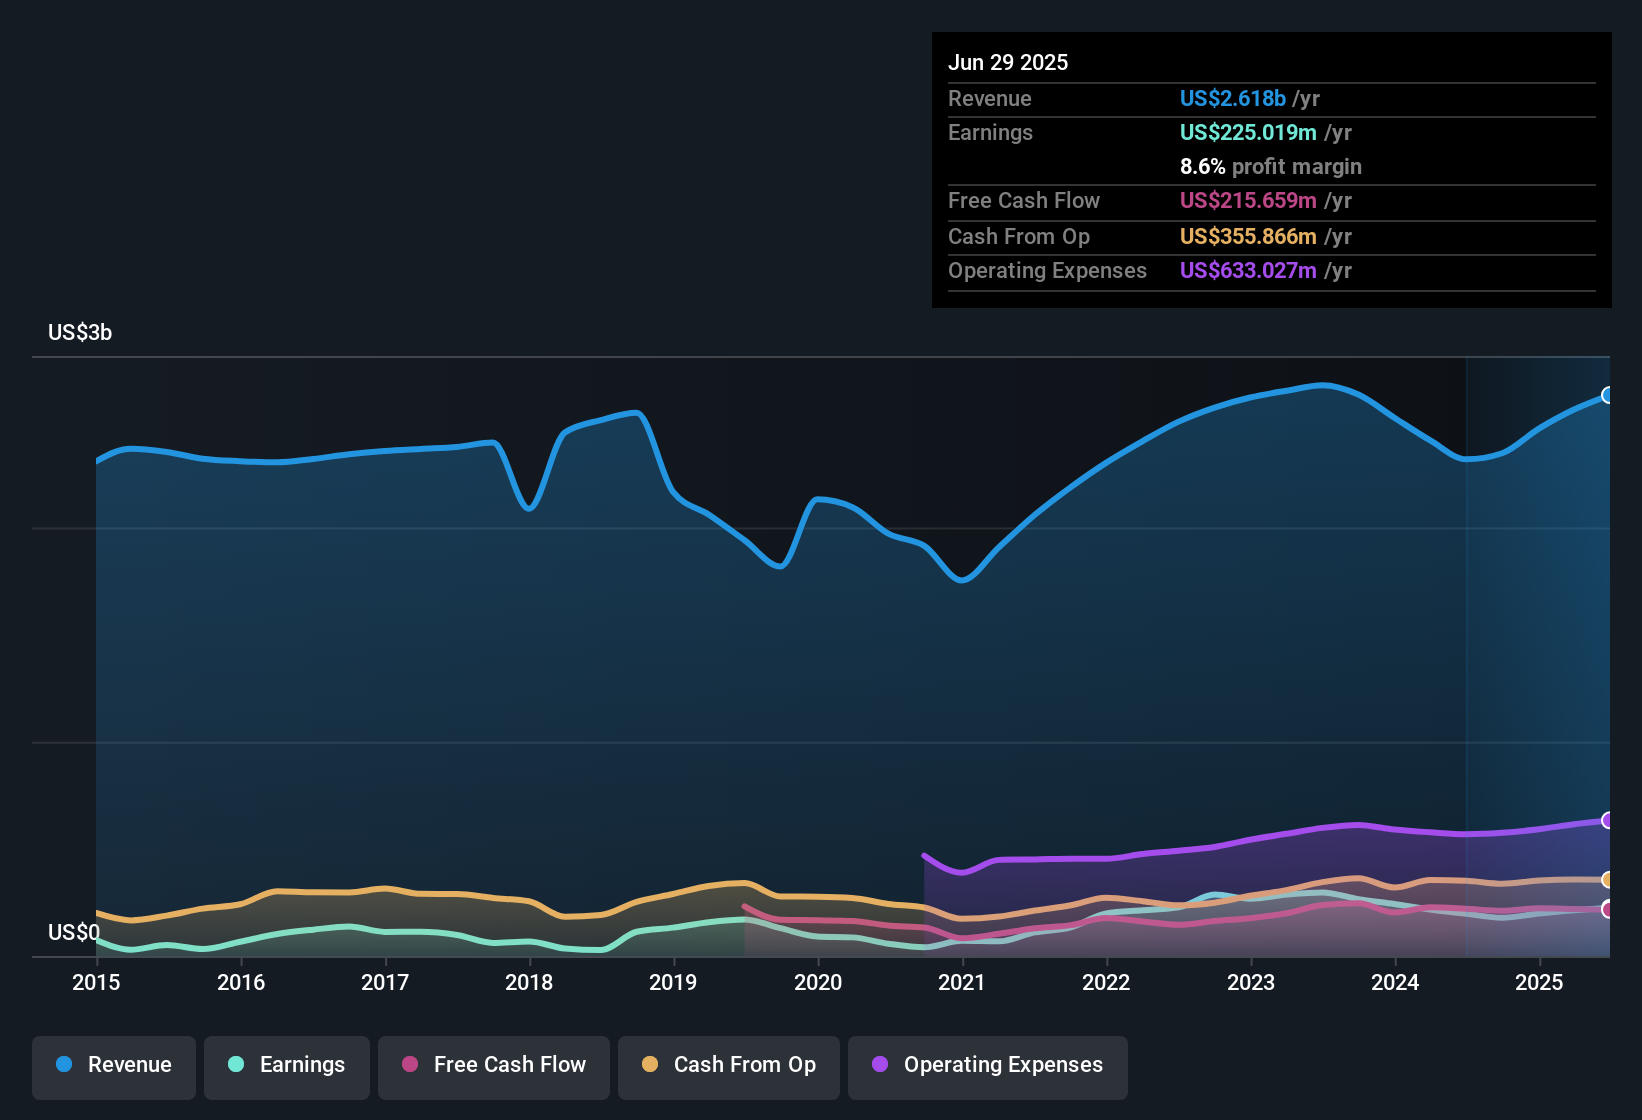
Belden (BDC) reported EPS growth of 14% over the last year, continuing a strong five-year trend of 15.4% annual earnings growth. Net profit margins ticked up to 8.6%, just above last year’s 8.5%. Both earnings and revenue are forecast to grow at 8% and 4.3% per year respectively, trailing the broader US market’s pace. With steady bottom-line expansion and margins remaining stable, recent results position the company as a reliable but slower-growth contender in its space.
See our full analysis for Belden.Next, we will weigh these headline numbers against the most popular narratives about Belden to see what the results confirm and where expectations might need a rethink.
Margin Expansion on the Horizon
- Analysts forecast net profit margins will increase from 8.6% today to 9.3% within three years, suggesting earnings power is set to improve even as revenue growth lags the broader market.
- According to the analysts' consensus view, strategic investments in software, integration, and selective M&A are expected to shift Belden’s product mix toward high-margin, recurring revenue streams, supporting both margin expansion and long-term earnings growth.
- Doubling the solutions revenue mix by 2028 is a focal point for recurring revenue and higher margins.
- Portfolio optimization and exposure to edge computing and cybersecurity are positioned as structural growth drivers, along with digital transformation tailwinds.
Share Count Reduction Adds Tailwind
- Analysts expect Belden’s shares outstanding will shrink by 1.78% annually over the next three years, providing an additional boost to per-share earnings even if total net income grows more slowly.
- The consensus perspective highlights that alongside steady margin gains, shrinking the share count could speed up EPS growth versus the top line. This reinforces confidence in the company’s ability to return capital to shareholders despite modest revenue forecasts.
- With lower share count, projected EPS growth outpaces total profit growth, which helps justify current and target valuations.
- This capital return strategy offers a degree of downside support, a point the consensus view regards as important given sector competition and macro pressures.
Valuation Discount Relative to Peers
- At a Price-To-Earnings Ratio of 21.5x, Belden trades below both the US Electronic industry average of 25.7x and well under the peer average of 46.5x. The current share price of $122.26 also sits below the DCF fair value of $129.79 and the analyst price target of $143.00.
- The consensus narrative notes that this relative valuation gap, combined with high-quality historic earnings growth, stands out as a central attraction, especially for investors seeking value in a sector where most peers fetch much higher multiples.
- Analysts argue sustained margin expansion and disciplined capital allocation could help narrow the valuation discount over time if execution remains strong.
- However, realizing the consensus target would require greater confidence that long-term profit forecasts and margin enhancements are not derailed by input cost volatility or integration challenges.
Next Steps
To see how these results tie into long-term growth, risks, and valuation, check out the full range of community narratives for Belden on Simply Wall St. Add the company to your watchlist or portfolio so you'll be alerted when the story evolves.
Have a different take on the data? Share your viewpoint and craft your own unique narrative in just a few minutes: Do it your way
A great starting point for your Belden research is our analysis highlighting 4 key rewards and 1 important warning sign that could impact your investment decision.
See What Else Is Out There
Belden’s slower top-line growth and reliance on margin expansion highlight that its earnings prospects may lag peers that are focused on stronger, more consistent revenue gains.
If you want steadier growth potential, check out stable growth stocks screener (2110 results) to uncover companies consistently expanding revenues and earnings across changing market cycles.
This article by Simply Wall St is general in nature. We provide commentary based on historical data and analyst forecasts only using an unbiased methodology and our articles are not intended to be financial advice. It does not constitute a recommendation to buy or sell any stock, and does not take account of your objectives, or your financial situation. We aim to bring you long-term focused analysis driven by fundamental data. Note that our analysis may not factor in the latest price-sensitive company announcements or qualitative material. Simply Wall St has no position in any stocks mentioned.