Best Buy (BBY): Net Margin Falls to 1.5%, Challenging Bullish Recovery Narratives
Best Buy Co.,Inc. BBY | 64.31 64.31 | +0.17% 0.00% Pre |
Best Buy (BBY) has just released its Q3 2026 results, reporting $9.7 billion in revenue and basic EPS of $0.66, with net income of $140 million. Looking at prior periods, quarterly revenue has increased from $8.8 billion in Q1 to $9.4 billion in Q2 and now stands at $9.7 billion, while EPS has declined from $0.95 in Q1 and $0.88 in Q2. As investors examine these results, factors such as compressed margins and the relationship between sales growth and earnings will likely attract attention heading into the next quarter.
See our full analysis for Best Buy.Next, we’ll see how these reported numbers compare against prevailing market narratives; some expectations may be met, while others could face a reality check.
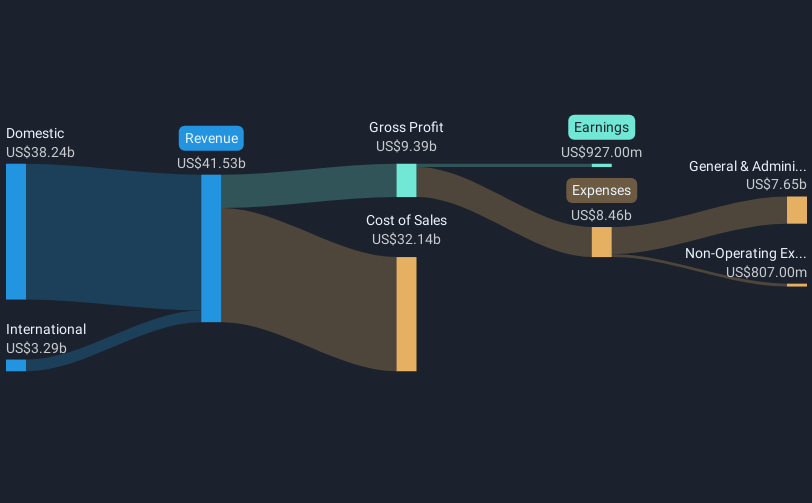
Net Margin Drops to 1.5%
- Net profit margin has decreased from 3% to 1.5% over the past year, showing a pronounced decline in earnings quality even as revenue has moved modestly upward. One-off losses of $882 million contributed heavily.
- Analysts' consensus view points out that while net income dropped to $645 million for the trailing twelve months, consensus expects margins to stabilize thanks to service attachments and new digital revenue streams.
- However, the past five-year trend is sharply negative, with annualized earnings falling 20.9% per year despite the current forecast for improved margin driven by tech upgrade cycles and service growth.
- What’s surprising is how margins remain under pressure despite cost reduction efforts and digital expansion. This shows that execution, not just topline growth, will shape the recovery story.
- Anticipate the full consensus take on whether margin friction or recovery will win out this year. 📊 Read the full Best Buy Consensus Narrative.
Share Price Still 53% Below DCF Fair Value
- Even with the current share price at $80.98, Best Buy trades 53.7% below the DCF fair value of $174.99. This indicates significant disconnect between the market valuation and modeled fair value estimates.
- Analysts' consensus narrative highlights that while valuation looks attractive on a DCF basis, the stock’s 26.4x P/E is higher than both peer (21.8x) and industry (18.9x) averages.
- This presents a trade-off: slower long-term sales growth (2% yearly forecast versus the US market’s 10.5%) may cap immediate upside even if fair value models look favorable.
- However, with consensus price targets aligned closely at $83.95, there is limited near-term room for rerating unless the market sees evidence of sustainable earnings growth above forecasts.
Dividend Coverage a Weak Spot
- Best Buy’s dividend yield stands at 4.69%, but the data explicitly notes that current earnings do not cover this payout well, raising a red flag for anyone relying on income stability.
- Consensus analysis flags this as a key risk. Absent a quick rebound in profitability, high dividends may pressure cash flows and force tough choices later on.
- Recent quarterly net income fell to $140 million, even as dividend obligations remain, eroding coverage compared to historic levels.
- The risk is heightened by the persistent SG&A cost inflation and competition for tech retail, both of which threaten the ability to protect both margins and payout ratios if sales momentum slips.
Next Steps
To see how these results tie into long-term growth, risks, and valuation, check out the full range of community narratives for Best Buy on Simply Wall St. Add the company to your watchlist or portfolio so you'll be alerted when the story evolves.
Have another angle on the results? In just a few minutes, you can shape your own narrative and share your perspective. Do it your way.
A great starting point for your Best Buy research is our analysis highlighting 2 key rewards and 3 important warning signs that could impact your investment decision.
See What Else Is Out There
Best Buy’s falling net margins, earnings declines, and shaky dividend coverage all signal a business that is struggling to maintain financial stability as challenges mount.
If you want companies proving their payouts are reliable, check out these 1948 dividend stocks with yields > 3% to quickly spot those with yields backed by stronger earnings coverage today.
This article by Simply Wall St is general in nature. We provide commentary based on historical data and analyst forecasts only using an unbiased methodology and our articles are not intended to be financial advice. It does not constitute a recommendation to buy or sell any stock, and does not take account of your objectives, or your financial situation. We aim to bring you long-term focused analysis driven by fundamental data. Note that our analysis may not factor in the latest price-sensitive company announcements or qualitative material. Simply Wall St has no position in any stocks mentioned.