BlackRock (BLK) Stock After Recent Pullback Is The Long Term Story Still Attractive
BlackRock, Inc. BLK | 0.00 |
- Investors may be wondering if BlackRock at around US$1,016 per share still offers value, or if most of the easy gains are already behind it.
- The stock is up 5.0% over the past year but has fallen 6.9% over the last month and 6.3% year to date, which may have shifted how the market is pricing its risk and return profile.
- Recent headlines have focused on BlackRock's role in global asset management and its influence across ETFs and institutional portfolios, keeping the stock in the spotlight for long term capital allocators. In addition, ongoing debates around fees, fund flows, and regulation continue to frame how investors think about its future earnings power.
- In this context, BlackRock currently has a valuation score of 3/6, which means it screens as undervalued on half of the checks. The next sections will break down those valuation methods and will finish with a different way of thinking about value that many investors overlook.
Approach 1: BlackRock Excess Returns Analysis
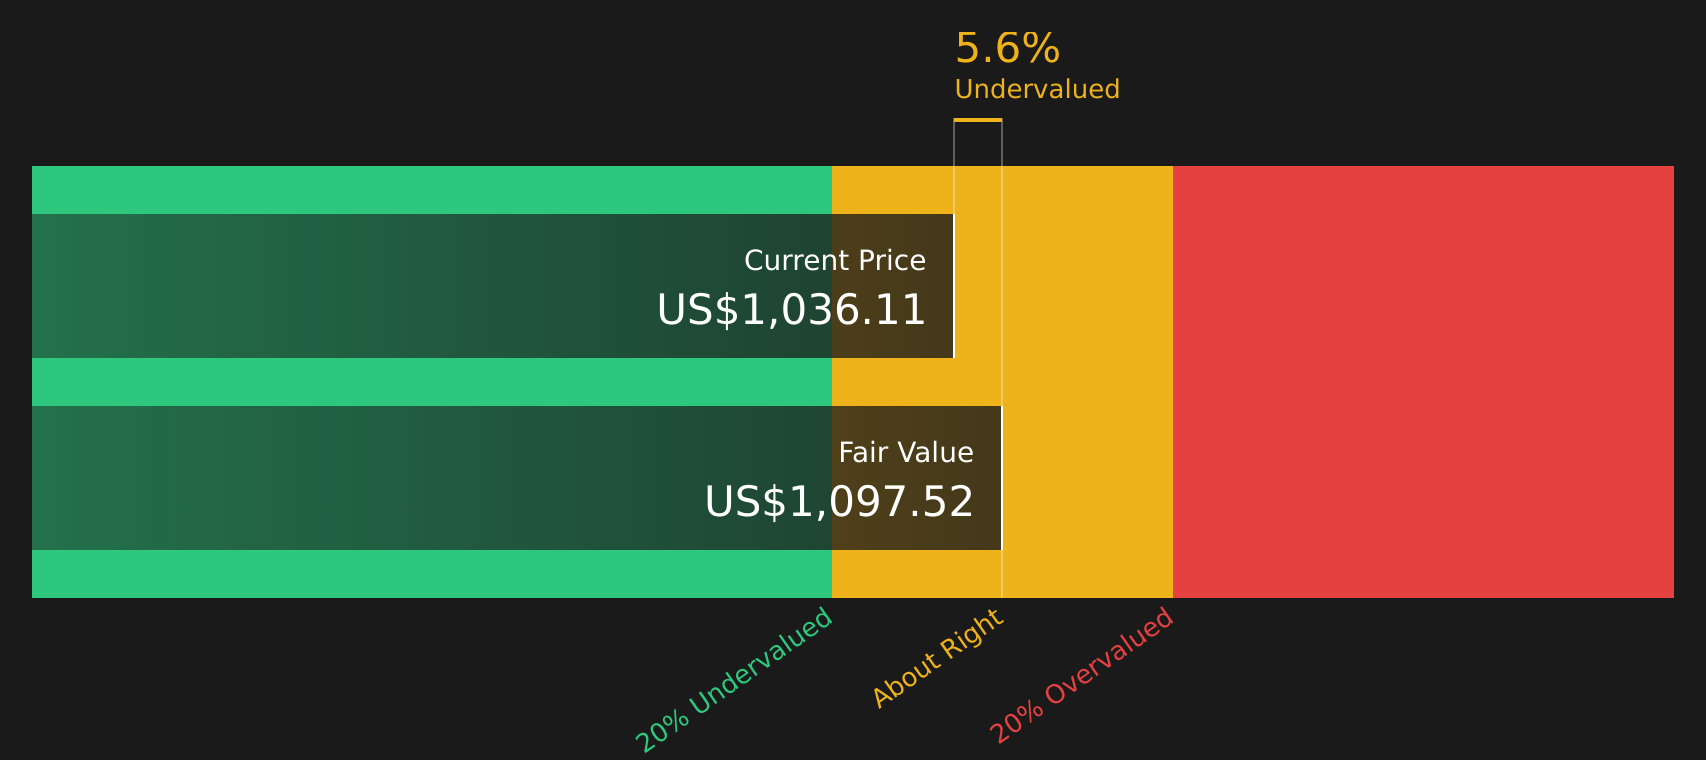
The Excess Returns Model looks at how much profit a company can generate over and above the return that shareholders require, then capitalizes those surplus profits into an intrinsic value per share.
For BlackRock, the model starts with a Book Value of $364.87 per share and a Stable EPS of $59.24 per share, based on weighted future Return on Equity estimates from 7 analysts. The Average Return on Equity is 16.01%, while the Cost of Equity is $29.19 per share. The gap between the earnings power and this required return is the Excess Return, calculated at $30.05 per share.
The Stable Book Value is $370.00 per share, sourced from weighted future Book Value estimates from 4 analysts. Combining this book value base with the projected excess returns leads to an estimated intrinsic value of about $1,061 per share.
Compared with the recent share price of around $1,016, the model points to the stock trading at roughly a 4.2% discount, which is a small margin.
Result: ABOUT RIGHT
BlackRock is fairly valued according to our Excess Returns, but this can change at a moment's notice. Track the value in your watchlist or portfolio and be alerted on when to act.
Approach 2: BlackRock Price vs Earnings
For a profitable company like BlackRock, the P/E ratio is a useful shorthand for how much investors are paying for each dollar of earnings. It ties directly to what you see on the income statement and is widely used to compare established, earnings-generating businesses.
What counts as a “normal” P/E depends on what the market expects from a company and how risky those earnings appear. Higher expected earnings growth or lower perceived risk can support a higher multiple, while slower growth or higher risk usually points to a lower, more cautious P/E.
BlackRock currently trades on a P/E of about 25.2x. That sits below the Capital Markets industry average of 39.5x, but above the peer group average of 16.9x. Simply Wall St’s Fair Ratio for BlackRock is 18.8x, which is a proprietary estimate of what the P/E “should” be given factors such as its earnings profile, industry, profit margin, market value and risk traits.
This Fair Ratio can be more informative than a simple peer or industry comparison because it adjusts for company-specific characteristics rather than relying on broad group averages. With the current P/E above the 18.8x Fair Ratio, the shares look slightly expensive on this metric.
Result: OVERVALUED

P/E ratios tell one story, but what if the real opportunity lies elsewhere? Start investing in legacies, not executives. Discover our 20 top founder-led companies.
Upgrade Your Decision Making: Choose your BlackRock Narrative
Earlier it was mentioned that there is an even better way to understand valuation, so Narratives are a simple way for you to write the story you see for BlackRock, link that story to a set of forecasts for revenue, earnings and margins, and then translate those forecasts into your own fair value that can be compared with the current price to help you decide whether the stock looks attractively priced or stretched.
On Simply Wall St, Narratives live in the Community page and are designed to be accessible, so you can pick assumptions rather than build a spreadsheet, and the platform then keeps the Narrative updated when fresh information such as earnings reports or news arrives.
For BlackRock, one investor Narrative on the Community page currently points to a fair value of about US$1,318.96, while another uses more cautious assumptions and lands closer to US$1,160.32, which shows how two investors looking at the same company can reach different but structured views that are both grounded in transparent numbers and a clear story.
Do you think there's more to the story for BlackRock? Head over to our Community to see what others are saying!

This article by Simply Wall St is general in nature. We provide commentary based on historical data and analyst forecasts only using an unbiased methodology and our articles are not intended to be financial advice. It does not constitute a recommendation to buy or sell any stock, and does not take account of your objectives, or your financial situation. We aim to bring you long-term focused analysis driven by fundamental data. Note that our analysis may not factor in the latest price-sensitive company announcements or qualitative material. Simply Wall St has no position in any stocks mentioned.