

Block (SQ) Stock Still Looks Undervalued Despite Its 71% Five Year Fall
Block XYZ | 0.00 |
Block stock is caught between two different valuation signals. The Excess Returns intrinsic value estimate points to meaningful upside from the current US$79.43 share price, while earnings based multiples flag the stock as expensive compared with its fundamentals.
- Block has declined 70.6% over the past 5 years, which leaves long term holders with a weak result and makes today’s entry point more sensitive to valuation.
- Recent AI driven restructuring and product rollout can support margin and cash flow expectations, while reliance on user growth and transaction volumes remains a key risk if these trends soften.
- The broader checks are mixed rather than conclusive, with Block passing 3 of 6 valuation tests according to our value score.
For investors, the debate is whether Block’s current price leans closer to the upside suggested by the intrinsic value estimate or the caution implied by the richer market multiples.
Does Block Look Undervalued on Excess Returns?
The Excess Returns model looks at how efficiently Block turns its equity base into profits above its estimated cost of equity. Block is assumed to earn a stable earnings power of $5.62 per share on a book value base of $36.70 per share, which implies an average return on equity of 12.32%.
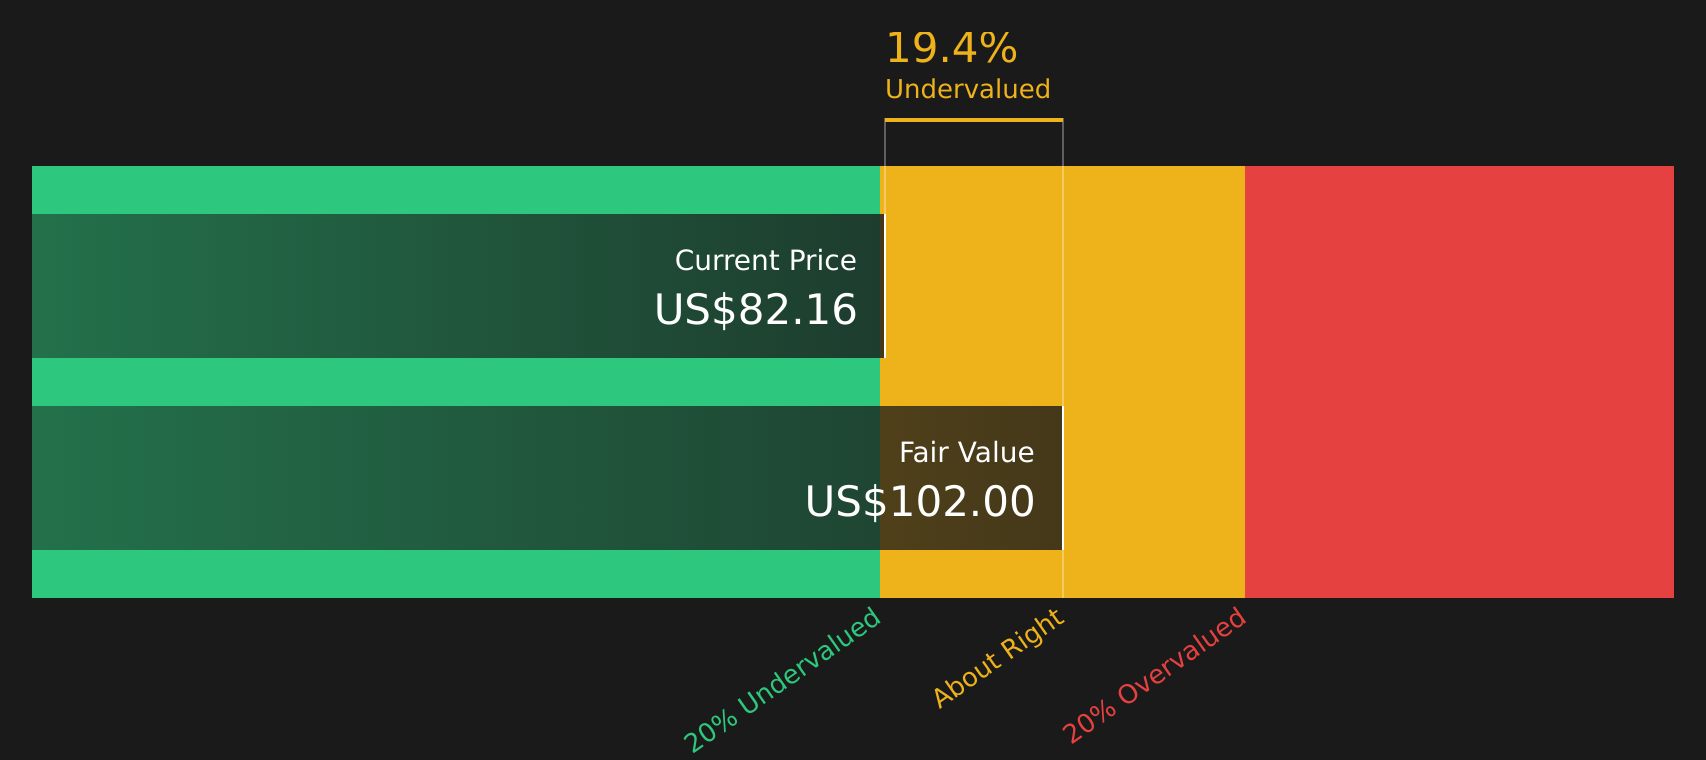
With a cost of equity of $3.45 per share and an excess return of $2.17 per share, the model projects value creation on top of a higher future equity base, using a stable book value estimate of $45.62 per share. That stream of excess returns leads to an intrinsic value estimate of $101.98 per share, compared with the current $79.43 price. This implies Block screens as about 22.1% undervalued on this method. Because the recent AI driven restructuring lifted margins and reshaped growth expectations, the current discount suggests the market is still cautious about how durable those returns will be.
On the Excess Returns view, Block stock currently looks undervalued relative to the earnings power implied by its equity base.
Our Excess Returns analysis suggests Block is undervalued by 22.1%. Track this in your watchlist or portfolio, or discover 50 more high quality undervalued stocks.
Has Block Run Too Far on Earnings?
The P/E ratio is a useful lens for Block because earnings are becoming a more important part of the story alongside its payments and software ecosystem.
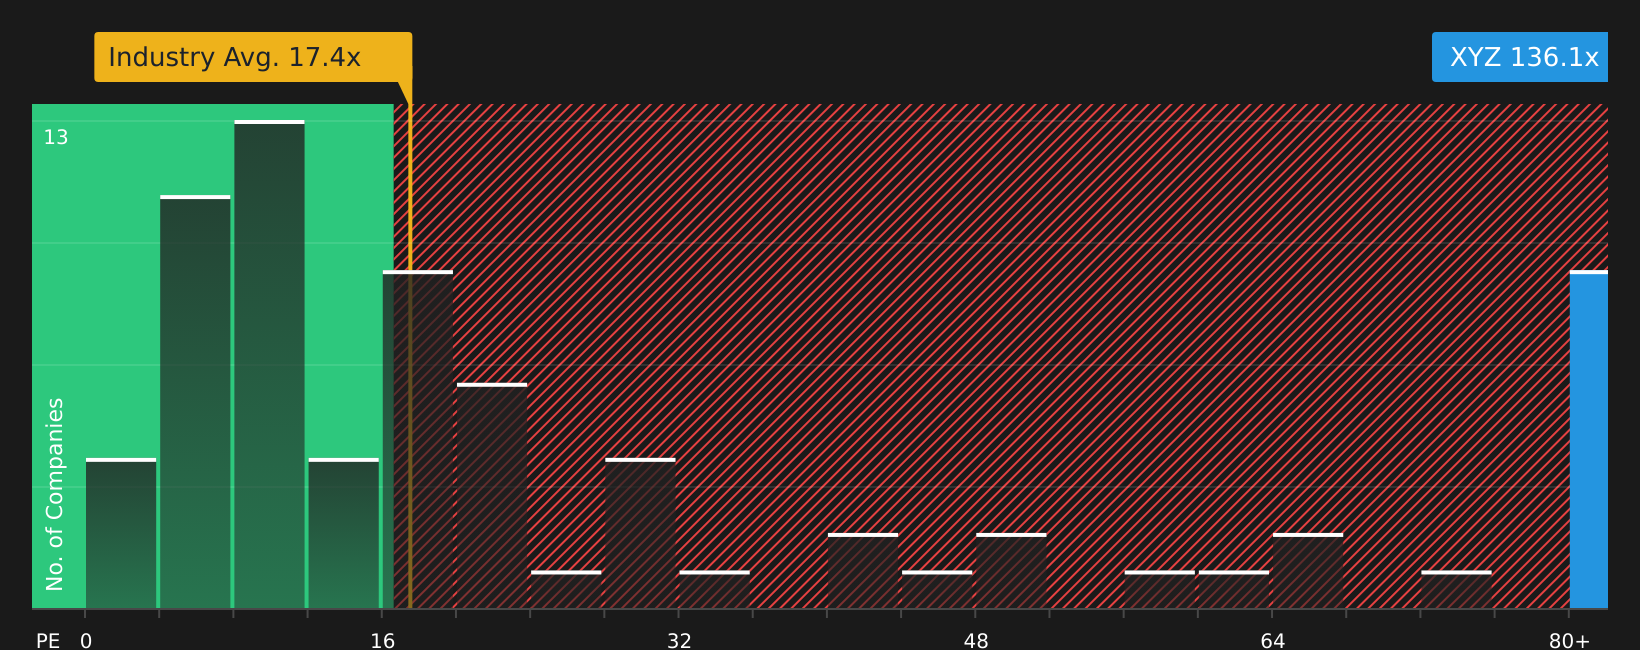
Block trades at about 133.6x earnings, which is far above the diversified financial industry average of 17.5x and well above the peer group average of 12.5x. The fair P/E ratio implied by the model is 35.7x, so the current multiple is several times higher than what the company specific inputs would suggest. This gap indicates investors are paying a high price for each dollar of Block’s earnings.
The difference between the current P/E and the modelled fair ratio is large enough that it is better read as a warning signal rather than a precise target. The framework is heavily penalising Block’s risk profile and the quality of earnings, so the current valuation screens as rich even before comparing it to sector norms.
On the P/E multiple, Block stock currently screens as overvalued relative to both its tailored fair ratio and broader industry benchmarks.
The Block Narrative: What Would Justify Today's Price?
Simply Wall St Narratives aim to connect Block's current valuation puzzle with the specific expectations that would need to play out for the stock to be worth materially more or less than today’s price, based on growth, margins and earnings. Each narrative ties its number to a clear view on how Block's growth, profitability and risk profile could evolve, which you can revisit as fresh financial results and operating data emerge on the Community page.
Investor narratives on Block are pulling in very different directions, with one camp focused on product driven upside and another on mounting structural risks.
Bull case: 19% undervalued
"Continued expansion of embedded banking and lending products (Borrow and BNPL) within Cash App, fueled by proprietary credit scoring and increasing eligibility/limits, is opening new user cohorts and higher ARPU segments..."
Bear case: 11% overvalued
"Fierce competition from both established players and new market entrants is expected to intensify and commoditize core payment and financial services, forcing lower transaction fees across the industry and compressing Block's net margins as it struggles to defend its market share..."
Do you think there's more to the story for Block? Head over to our Community to see what others are saying!
The Bottom Line
Block’s intrinsic value work using the Excess Returns model points to meaningful upside, while the P/E view flags the stock as clearly overvalued relative to both its tailored fair ratio and peers. That split reflects two different lenses. Intrinsic value leans on the durability of earnings on the equity base and the funding and reinvestment needs. Market multiples are more about how confident investors feel in Block’s growth, margin path and risk profile today. The key question from here is whether Block can deliver margins and cash flows that justify its rich multiple, or whether the current discount to intrinsic value proves to be a value trap.
This article by Simply Wall St is general in nature. We provide commentary based on historical data and analyst forecasts only using an unbiased methodology and our articles are not intended to be financial advice. It does not constitute a recommendation to buy or sell any stock, and does not take account of your objectives, or your financial situation. We aim to bring you long-term focused analysis driven by fundamental data. Note that our analysis may not factor in the latest price-sensitive company announcements or qualitative material. Simply Wall St has no position in any stocks mentioned.