Blue Ridge Bankshares (BRBS) Net Interest Margin Recovery Tests Bullish Narratives On Profitability
Blue Ridge Bankshares, Inc. BRBS | 4.12 | -1.90% |
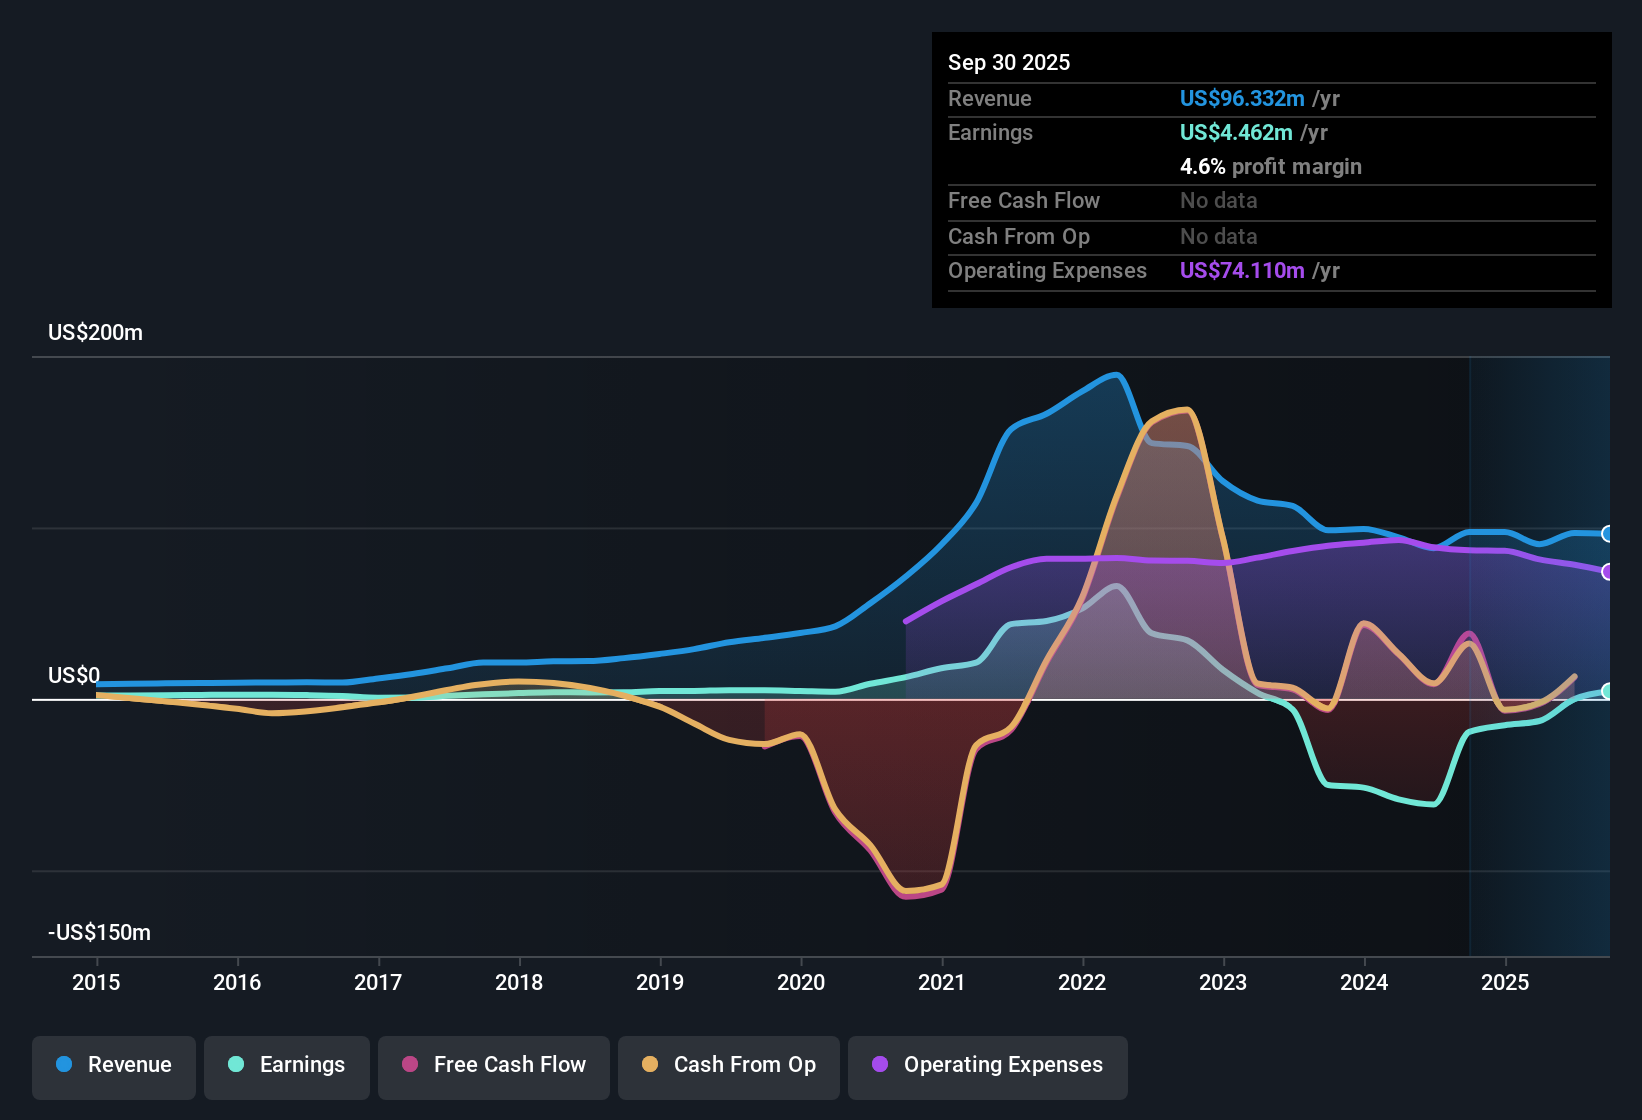
Blue Ridge Bankshares (BRBS) closed out FY 2025 with fourth quarter revenue of US$22.3 million and EPS of US$0.04, while trailing twelve month EPS came in at US$0.11 on revenue of US$95.7 million. Over the past few quarters, the company has seen revenue move from US$27.5 million in Q3 2025 to US$22.3 million in Q4 2025, with quarterly EPS ranging from a loss of US$0.01 in Q1 2025 to US$0.06 in Q3 2025 before settling at US$0.04 in the latest period. For investors, the return to profitability alongside these revenue and EPS levels points to a story that now hinges on how sustainably the bank can defend its margins.
See our full analysis for Blue Ridge Bankshares.With the latest figures on the table, the next step is to compare these results with the widely discussed narratives about Blue Ridge Bankshares and to identify where the numbers may reinforce or challenge those stories.
Net Interest Margin Climbs From 2.9% To 3.6%
- Across 2025, reported net interest margin moved from 2.9% in Q1 to 3.15% in Q2 and then to 3.6% in Q3.
- Bulls might point to this higher margin as a quality signal. However, the five year earnings decline of 46.4% a year highlights that better spreads in 2025 sit against a much weaker multi year profit record.
- The trailing twelve month net income of US$10.7 million flips the business back into profit, but it follows earlier trailing losses such as US$19.1 million in 2024 Q3.
- That mix of improving margin data and a long stretch of shrinking earnings means any bullish argument needs to factor in both the recent progress and the earlier drag.
Loan Book Shrinks While Problem Loans Stay Elevated
- Total loans moved from US$2,179.5 million in 2024 Q3 to US$1,911.5 million in 2025 Q3, while non performing loans over that span ranged between US$32.1 million and US$23.99 million.
- Bears often focus on credit risk, and here they have some numbers to work with, as the allowance for bad loans is flagged at 72% and non performing loans stayed in the tens of millions even as the loan book was smaller.
- The reported 72% allowance, compared against a 100% benchmark, points to a relatively light buffer if credit conditions became more stressed.
- At the same time, non performing loans of US$28.6 million in 2025 Q3 and US$23.99 million in 2025 Q2 show that asset quality is an ongoing factor in how cautious investors are likely to be.
Premium 34.9x P/E Versus 11.8x Industry
- The stock trades on a P/E of 34.9x, which sits well above both the peer average of 12.9x and the US banks industry average of 11.8x, while the trailing twelve month EPS is US$0.11 on net income of US$10.7 million.
- What stands out for valuation focused investors is that this high P/E multiple comes despite that 46.4% annualized earnings decline over five years. As a result, the current US$4.25 share price embeds relatively optimistic expectations after only a recent return to profitability.
- The move from a trailing loss of US$15.4 million in 2024 Q4 to a trailing profit of US$10.7 million by 2025 Q4 helps explain why some investors might accept a premium price tag.
- However, the combination of a premium P/E and the earlier multi year earnings slide is exactly the kind of tension more cautious investors tend to weigh carefully.
Next Steps
Don't just look at this quarter; the real story is in the long-term trend. We've done an in-depth analysis on Blue Ridge Bankshares's growth and its valuation to see if today's price is a bargain. Add the company to your watchlist or portfolio now so you don't miss the next big move.
See What Else Is Out There
Blue Ridge Bankshares combines a premium 34.9x P/E and a shrinking loan book with a five year earnings decline and ongoing concerns around problem loans and reserves.
If rich valuation, earnings pressure, and credit worries give you pause, check out solid balance sheet and fundamentals stocks screener (391 results) to focus on companies with sturdier finances and more resilient balance sheets.
This article by Simply Wall St is general in nature. We provide commentary based on historical data and analyst forecasts only using an unbiased methodology and our articles are not intended to be financial advice. It does not constitute a recommendation to buy or sell any stock, and does not take account of your objectives, or your financial situation. We aim to bring you long-term focused analysis driven by fundamental data. Note that our analysis may not factor in the latest price-sensitive company announcements or qualitative material. Simply Wall St has no position in any stocks mentioned.