Bowhead Specialty Holdings (BOW) Could Be 40% Below Fair Value On Russell Value Index Shift
Bowhead Specialty Holdings Inc. BOW | 0.00 |
Bowhead Specialty Holdings (BOW) has just been shifted across the Russell index family, moving out of several growth benchmarks and into multiple value and value defensive indices. This change may reshape how many institutional investors view the stock.
Over the past quarter Bowhead Specialty Holdings has seen strong price momentum, with a 30 day share price return of 29.0% and a 90 day share price return of 40.6%. However, the 1 year total shareholder return is still down 12.0%, suggesting recent gains are rebuilding confidence after a weaker stretch.
If the index shift has you thinking about where else value oriented capital might move next, it could be a good moment to broaden your search with 20 top founder-led companies
So with Bowhead Specialty Holdings now tagged as a value stock, trading around its analyst price target yet showing solid recent momentum and an indicated 40% intrinsic discount, is this a genuine mispricing, or is the market already banking on future growth?
Most Popular Narrative: 20% Overvalued
Bowhead Specialty Holdings last closed at $31.48, slightly above the most followed fair value estimate of $31.43 that uses a 7.1% discount rate and detailed growth assumptions.
Rapid premium growth across all underwriting divisions, especially in underserved and complex risk areas like excess Casualty and Healthcare Liability, indicates Bowhead is well positioned to benefit from growing demand for specialized insurance solutions as risk complexity rises, which should drive ongoing revenue and top-line growth.
Want to see what is backing that fair value for Bowhead Specialty Holdings? The narrative leans on fast growing premiums, firmer margins, and a richer earnings multiple. Curious how those pieces fit together over the next few years and what that implies for future earnings power?
Result: Fair Value of $31.43 (OVERVALUED)
However, Bowhead Specialty Holdings still faces meaningful risks, including exposure to volatile long tail casualty lines and potential reserve shortfalls if claims trends worsen, which could pressure margins.
Another View: SWS DCF Fair Value For Bowhead Specialty Holdings
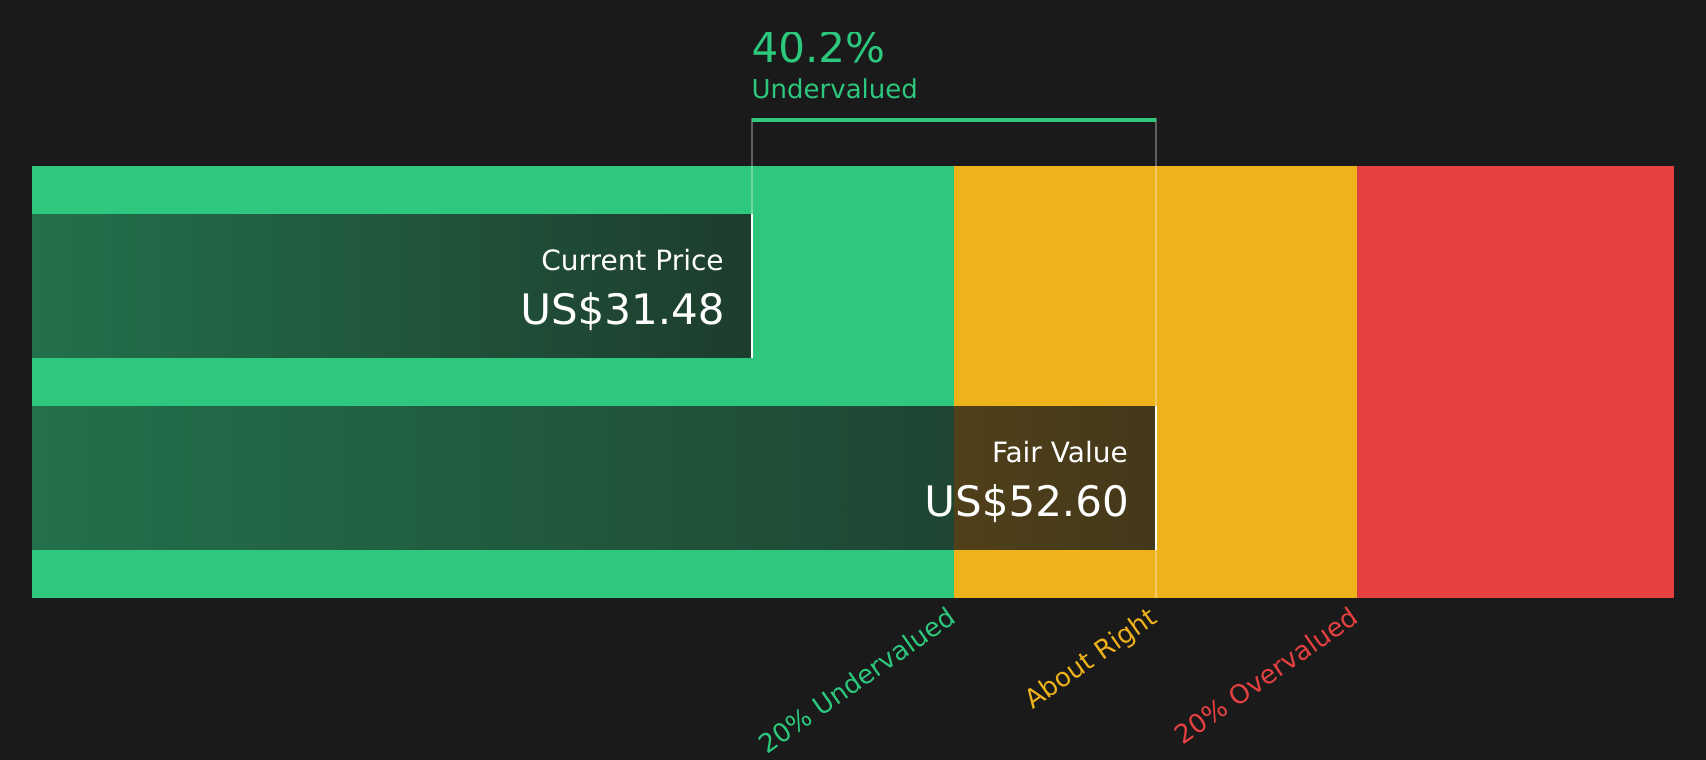
The analyst narratives suggest Bowhead Specialty Holdings is about 20% overvalued at $31.48 versus a $31.43 fair value built on earnings forecasts and a 12.3x P/E in 2029. Our DCF model presents a different perspective, with a future cash flow value of $52.60 that implies the stock trades at a steep discount. Which lens do you trust when the signals conflict this sharply?
Simply Wall St performs a discounted cash flow (DCF) on every stock in the world every day (check out Bowhead Specialty Holdings for example). We show the entire calculation in full. You can track the result in your watchlist or portfolio and be alerted when this changes, or use our stock screener to discover 44 high quality undervalued stocks. If you save a screener we even alert you when new companies match - so you never miss a potential opportunity.
Next Steps
If the mixed signals on Bowhead Specialty Holdings leave you unsure, take a moment to review the full picture and examine the potential upside case for yourself with 3 key rewards
Looking for more investment ideas beyond Bowhead Specialty Holdings?
Bowhead Specialty Holdings might be on your radar now, but you do not want your portfolio hinging on a single story when other compelling setups are available.
- Target reliable income streams by reviewing companies in the 7 dividend fortresses that could strengthen the yield side of your portfolio.
- Spot potential mispricings early by scanning the screener containing 18 high quality undiscovered gems before other investors catch on.
- Tighten your risk profile by focusing on companies in the 74 resilient stocks with low risk scores that may better match your comfort level.
This article by Simply Wall St is general in nature. We provide commentary based on historical data and analyst forecasts only using an unbiased methodology and our articles are not intended to be financial advice. It does not constitute a recommendation to buy or sell any stock, and does not take account of your objectives, or your financial situation. We aim to bring you long-term focused analysis driven by fundamental data. Note that our analysis may not factor in the latest price-sensitive company announcements or qualitative material. Simply Wall St has no position in any stocks mentioned.