

BrightView Holdings (BV) Valuation Check As Recent Returns Soften And Narratives Diverge
BrightView Holdings BV | 0.00 |
Recent performance snapshot
BrightView Holdings (BV) has traded around $11.80 recently, with the stock showing mixed returns, including a small fall over the past month and a larger decline over the past 3 months.
Over a longer horizon, BrightView’s total return figures are varied, including a loss across the past 5 years but a very large gain across the past 3 years, which may catch your eye if you compare different holding periods.
At around $11.80, BrightView’s recent share price performance has been soft, with a 30-day share price return showing a decline of 2.72% and a 90-day share price return showing a decline of 10.27%, while the 3-year total shareholder return of 114.55% suggests earlier momentum has cooled.
If you are comparing BrightView with other ideas in your watchlist, this could be a good moment to widen the search and check out 19 top founder-led companies
So with the share price around $11.80, recent returns under pressure and analysts seeing upside to their price targets, should you view BrightView as undervalued, or assume the market is already pricing in all future growth?
Most Popular Narrative: 6.3% Overvalued
BrightView’s last close at $11.80 sits slightly above the most followed narrative fair value of $11.10. This frames the current price as a mild premium built on specific earnings and margin assumptions.
The assumed bearish price target for BrightView Holdings is $11.1, which represents up to two standard deviations below the consensus price target of $16.46. This valuation is based on what can be assumed as the expectations of BrightView Holdings's future earnings growth, profit margins and other risk factors from analysts on the more bearish end of the spectrum.
Investors may want to understand what kind of earnings ramp, margin profile and exit P/E multiple are embedded in that $11.10 fair value, and how much disagreement sits behind it.
Result: Fair Value of $11.10 (OVERVALUED)
However, there are still a couple of watchpoints, including higher debt costs limiting tech investment and tighter labor and environmental rules squeezing an already modest margin profile.
Another way to look at value
While the most followed narrative suggests BrightView is about 6.3% overvalued at $11.80 versus an $11.10 fair value, the SWS DCF model points in the opposite direction, with an estimated future cash flow value of $39.26. That is a very wide gap, so which story do you think is closer to reality?
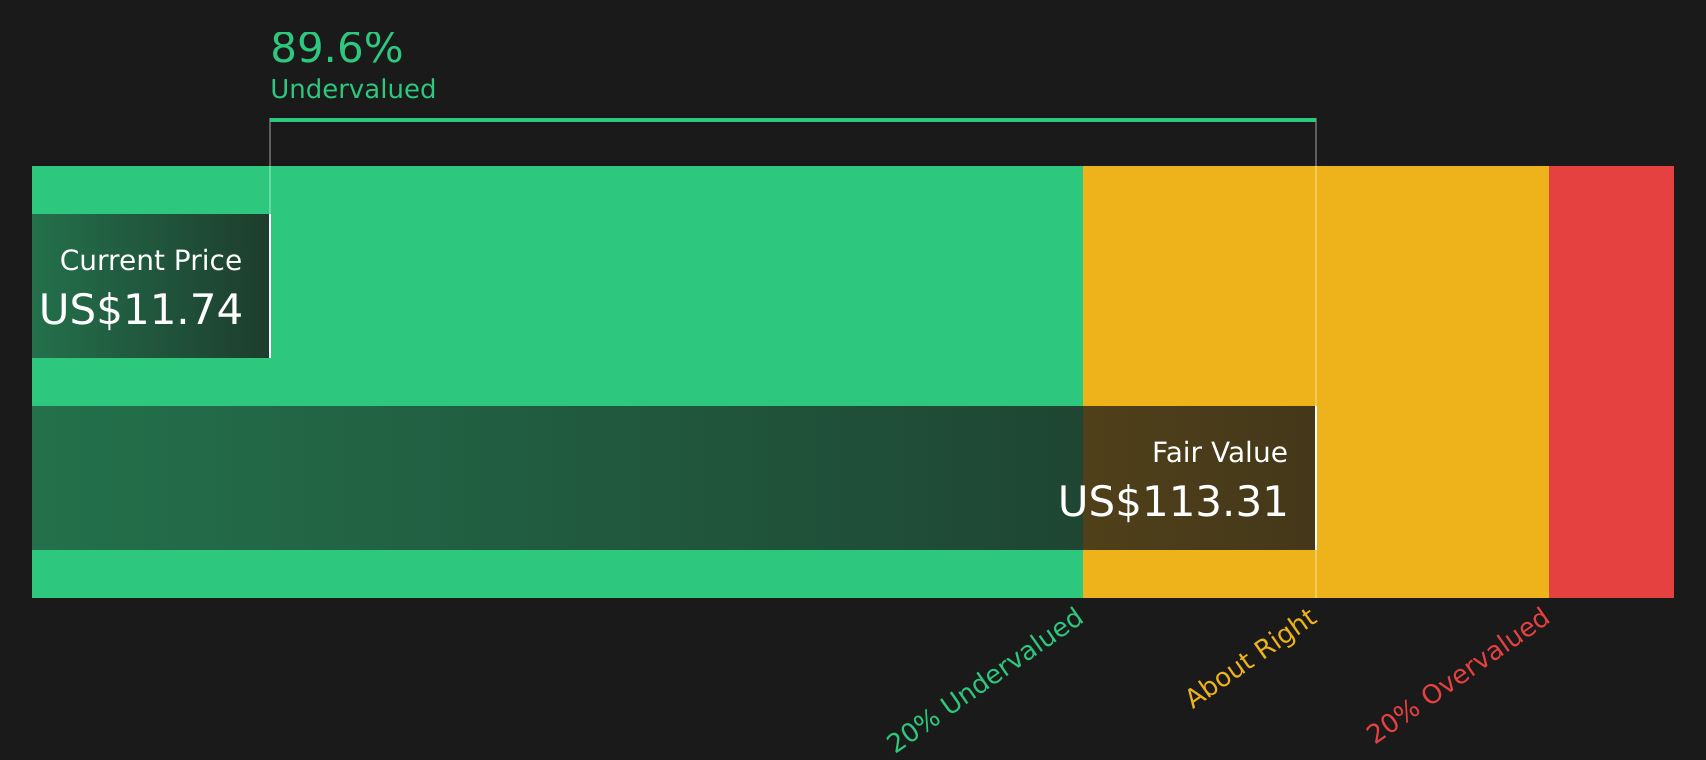
Simply Wall St performs a discounted cash flow (DCF) on every stock in the world every day (check out BrightView Holdings for example). We show the entire calculation in full. You can track the result in your watchlist or portfolio and be alerted when this changes, or use our stock screener to discover 62 high quality undervalued stocks. If you save a screener we even alert you when new companies match - so you never miss a potential opportunity.
Next Steps
Mixed signals around value and risk can be uncomfortable, so treat this as a prompt to check the numbers yourself and decide where you stand. To balance the concern around potential risks with the appeal of possible rewards, start by weighing the 2 key rewards and 3 important warning signs.
Looking for more investment ideas?
If BrightView has raised more questions than answers, treat that as your cue to broaden your watchlist and compare it with other targeted opportunities on Simply Wall St.
Use these focused stock ideas to pressure test your thinking and avoid missing companies that might better fit your return and risk expectations.
- Target potential mispricing by reviewing companies flagged in the 62 high quality undervalued stocks.
- Prioritize resilience by weighing businesses featured in the 73 resilient stocks with low risk scores.
- Hunt for lesser known opportunities by scanning the screener containing 24 high quality undiscovered gems.
This article by Simply Wall St is general in nature. We provide commentary based on historical data and analyst forecasts only using an unbiased methodology and our articles are not intended to be financial advice. It does not constitute a recommendation to buy or sell any stock, and does not take account of your objectives, or your financial situation. We aim to bring you long-term focused analysis driven by fundamental data. Note that our analysis may not factor in the latest price-sensitive company announcements or qualitative material. Simply Wall St has no position in any stocks mentioned.