Brixmor Property Group (BRX) Stock After Retail REIT News And Recent Price Pullback
Brixmor Property Group, Inc. BRX | 0.00 |
- If you are wondering whether Brixmor Property Group is attractively priced or starting to look stretched, the current share price puts valuation questions front and center.
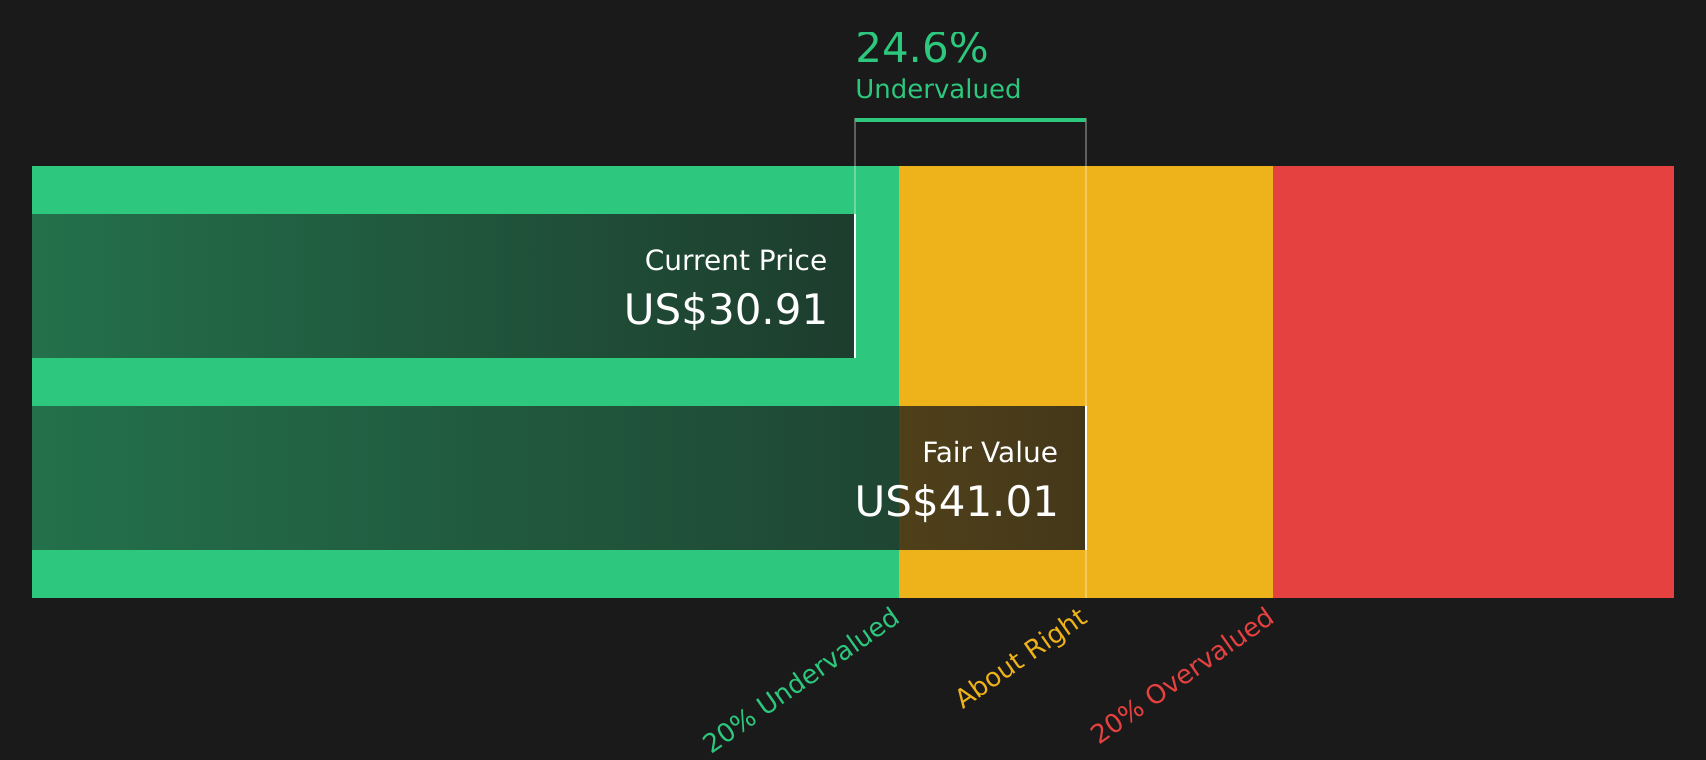
- The stock recently closed at US$30.91, with returns of 19.1% year to date and 25.3% over the past year. It has slipped 3.9% in the last week and is up 3.5% over the last month.
- Recent news flow around Brixmor Property Group has focused on its role as a retail focused real estate investment trust. Investors are paying attention to how its shopping center portfolio is positioned in a changing consumer environment. Commentary has also highlighted sector wide factors such as interest rate expectations and demand for retail space, which help frame the latest share price moves.
- Brixmor Property Group currently has a valuation score of 5/6, reflecting how it screens across different valuation checks. The next sections will break down those methods before coming back to an even broader way of thinking about what the stock might be worth.
Approach 1: Brixmor Property Group Discounted Cash Flow (DCF) Analysis
The DCF model for Brixmor Property Group looks at how much cash the company is expected to generate in the future, then discounts those adjusted funds from operations back to today to estimate what the stock might be worth.
Brixmor Property Group is modeled using a 2 stage Free Cash Flow to Equity approach based on adjusted funds from operations. The latest twelve month free cash flow is reported at $693.3 million. Analyst inputs are provided out to 2029, with projections extending to 2035, and Simply Wall St extrapolates the later years beyond the analyst horizon. For example, projected free cash flow for 2030 is $662.9 million, with further estimates for 2031 to 2035 all remaining below $1b a year.
When all these projected cash flows are discounted back and combined, the model arrives at an estimated intrinsic value of $41.10 per share. Compared with the recent share price of $30.91, this implies the stock is 24.8% undervalued according to this DCF framework.
Result: UNDERVALUED
Our Discounted Cash Flow (DCF) analysis suggests Brixmor Property Group is undervalued by 24.8%. Track this in your watchlist or portfolio, or discover 45 more high quality undervalued stocks.
Approach 2: Brixmor Property Group Price vs Earnings
For a profitable company like Brixmor Property Group, the P/E ratio is a useful way to think about what you are paying for each dollar of current earnings. A higher P/E usually reflects stronger growth expectations or lower perceived risk, while a lower P/E can point to more modest growth assumptions or higher risk.
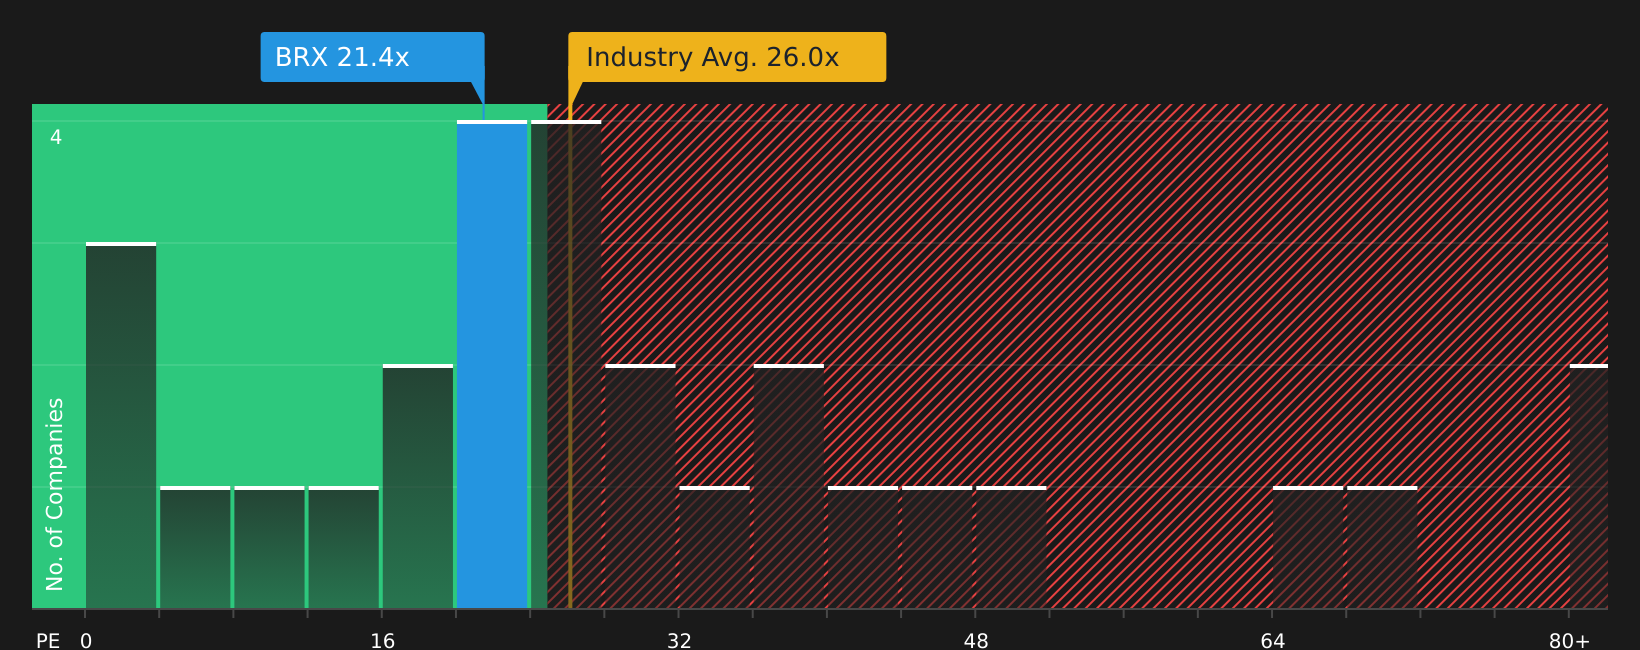
Brixmor Property Group currently trades on a P/E of 21.38x. That sits below the Retail REITs industry average P/E of 26.01x and also below the peer group average of 27.74x. On these simple comparisons, the stock is priced at a lower multiple of earnings than many industry peers.
Simply Wall St also provides a “Fair Ratio” of 28.22x, which is an estimate of what Brixmor Property Group’s P/E might be based on factors such as its earnings growth profile, industry, profit margins, market value and risk characteristics. This Fair Ratio can be more informative than a straight comparison with peers or the sector, because it adjusts for company specific features rather than assuming all stocks in the group deserve the same multiple. Comparing the Fair Ratio of 28.22x with the current P/E of 21.38x indicates the stock is trading below this Fair Ratio estimate.
Result: UNDERVALUED
P/E ratios tell one story, but what if the real opportunity lies elsewhere? Start investing in legacies, not executives. Discover our 20 top founder-led companies.
Upgrade Your Decision Making: Choose your Brixmor Property Group Narrative
Earlier it was mentioned that there is an even better way to understand valuation. Narratives take your view of Brixmor Property Group’s business, link that story to specific revenue, earnings and margin forecasts, turn those into a fair value, then compare that figure with the current share price. All of this happens within Simply Wall St’s Community page where millions of investors share views. Because Narratives refresh automatically when new earnings, news or analyst assumptions arrive, two investors can look at the same stock and reach very different conclusions. For example, one Brixmor Property Group Narrative may lean closer to the higher analyst earnings expectation of US$407.1 million and a higher justified P/E, while another may sit near the lower US$317.3 million earnings view and a more conservative multiple. This gives each investor a clear, numbers based way to decide whether the price or their Fair Value implies it could be time to act or wait.
Do you think there's more to the story for Brixmor Property Group? Head over to our Community to see what others are saying!

This article by Simply Wall St is general in nature. We provide commentary based on historical data and analyst forecasts only using an unbiased methodology and our articles are not intended to be financial advice. It does not constitute a recommendation to buy or sell any stock, and does not take account of your objectives, or your financial situation. We aim to bring you long-term focused analysis driven by fundamental data. Note that our analysis may not factor in the latest price-sensitive company announcements or qualitative material. Simply Wall St has no position in any stocks mentioned.