Bruker (BRKR) Q3 Loss Of US$62 Million Tests Bullish Margin Narratives
Bruker Corporation BRKR | 36.76 | +1.88% |
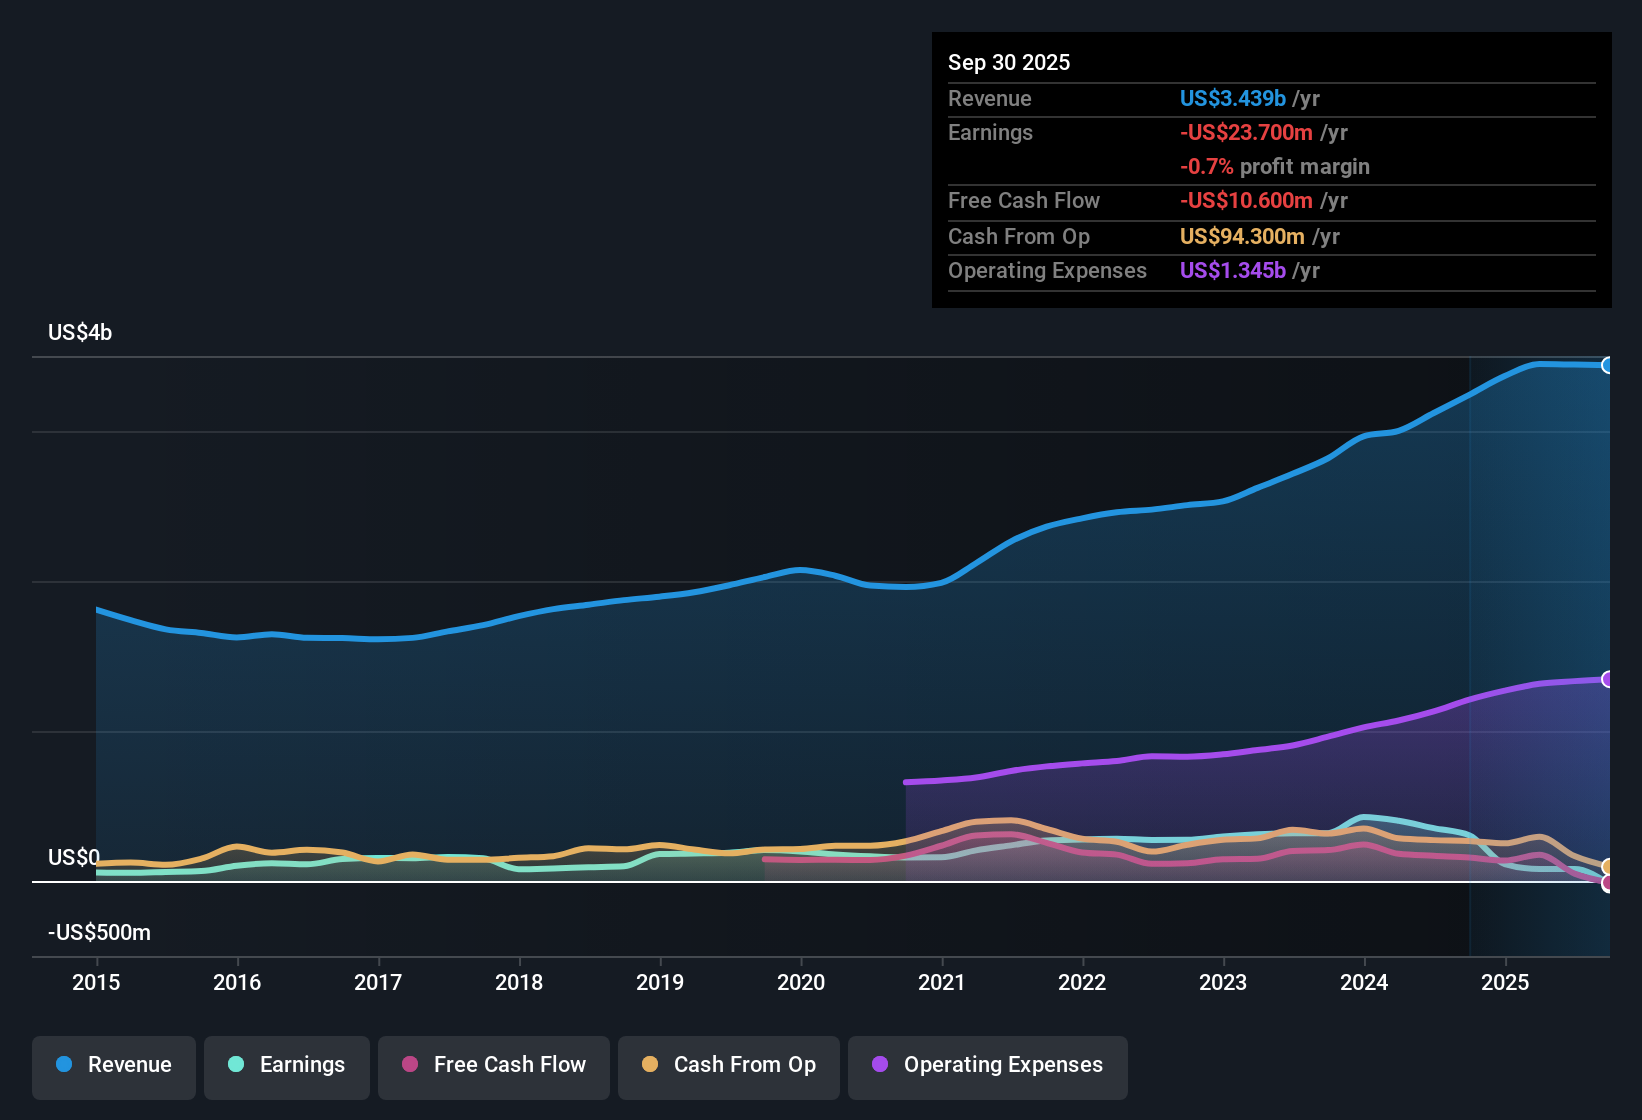
Bruker (BRKR) just posted its FY 2025 third quarter numbers with revenue of US$860.5 million and a basic EPS loss of US$0.41, while trailing twelve month revenue sits at about US$3.4 billion with a small net loss. The company has seen quarterly revenue move from US$800.7 million in Q2 2024 to US$979.6 million in Q4 2024, then track around the low US$800 million range through the first three quarters of 2025, as EPS shifted from a modest profit in early 2025 into a Q3 loss. With margins currently in the red on a trailing basis, this set of results puts profitability and cost discipline firmly in focus for investors.
See our full analysis for Bruker.With the numbers on the table, the next step is to see how this earnings profile lines up with the widely held narratives around Bruker, and where those stories may need to be rethought.
Twelve month loss of US$23.7 million despite US$3.4b in sales
- Over the last twelve months, Bruker generated about US$3.4b in revenue but recorded a net loss of US$23.7 million and a basic EPS loss of US$0.16.
- Consensus narrative talks about funding recovery and cost savings lifting margins over time, yet the latest trailing figures show losses and an EPS swing from a US$0.53 profit to a US$0.16 loss, which means those margin improvement ideas are not yet visible in the reported numbers.
Q3 swing to US$62.4 million loss tests bullish margin story
- Q3 FY 2025 showed revenue of US$860.5 million and a net loss of US$62.4 million, compared with profits in each of the previous four quarters, so the EPS moved from a US$0.11 profit in Q1 to a US$0.41 loss in Q3.
- Bulls expect cost cuts of US$100 million to US$120 million a year and higher margin products to lift earnings, yet this latest quarter shows a sizeable loss, so
- the move from US$17.4 million net income in Q1 2025 to a US$62.4 million loss in Q3 2025 highlights how far reported profitability is from the higher margin assumptions in the bullish story,
- and the shift from a trailing net profit of US$79.6 million at Q1 2025 to a US$23.7 million loss by Q3 2025 means bulls are relying on a future turnaround that is not reflected in recent earnings yet.
SOME investors see the current loss-making run as a setup for a sharp earnings rebound if the bullish thesis plays out, while others think it underlines how much execution work is still ahead. 🐂 Bruker Bull Case
Cheap P/S at 1.7x but weak cash cover for debt
- Bruker trades on a P/S of 1.7x versus about 2.9x for the wider US Life Sciences industry and 2.8x for peers, while being unprofitable over the last year with net losses growing at about 8.8% per year over five years and operating cash flow that does not fully cover debt.
- Bears highlight the combination of ongoing losses and soft demand, and the recent data lines up with that concern, because
- trailing twelve month EPS moved from a US$0.53 profit at Q1 2025 to a US$0.16 loss at Q3 2025 even as revenue edged around US$3.4b, pointing to pressure on margins,
- and the fact that losses have grown over roughly five years, alongside debt that is not well covered by operating cash flow, means the lower 1.7x P/S multiple can be read as the market pricing in those financing and profitability risks.
For investors who worry that the low P/S is a value trap rather than a bargain, the earnings trend and cash coverage issues are exactly what they focus on before committing new capital. 🐻 Bruker Bear Case
Next Steps
To see how these results tie into long-term growth, risks, and valuation, check out the full range of community narratives for Bruker on Simply Wall St. Add the company to your watchlist or portfolio so you'll be alerted when the story evolves.
See the numbers differently? If this data leads you to a different conclusion, shape your own view in just a few minutes and Do it your way
A great starting point for your Bruker research is our analysis highlighting 2 key rewards and 2 important warning signs that could impact your investment decision.
See What Else Is Out There
Bruker is wrestling with losses, weakening EPS and thin cash cover for debt, which keeps its low 1.7x P/S ratio under a cloud.
If you want ideas where financial footing is steadier, use our solid balance sheet and fundamentals stocks screener (45 results) to quickly zero in on companies with stronger balance sheets and potentially lower downside risk.
This article by Simply Wall St is general in nature. We provide commentary based on historical data and analyst forecasts only using an unbiased methodology and our articles are not intended to be financial advice. It does not constitute a recommendation to buy or sell any stock, and does not take account of your objectives, or your financial situation. We aim to bring you long-term focused analysis driven by fundamental data. Note that our analysis may not factor in the latest price-sensitive company announcements or qualitative material. Simply Wall St has no position in any stocks mentioned.