Butterfield Bank (NTB) Net Interest Margin Holds At 2.69% Challenging Bearish Profitability Narratives
Bank of N.T. Butterfield & Son Limited (The) NTB | 53.47 | +0.91% |
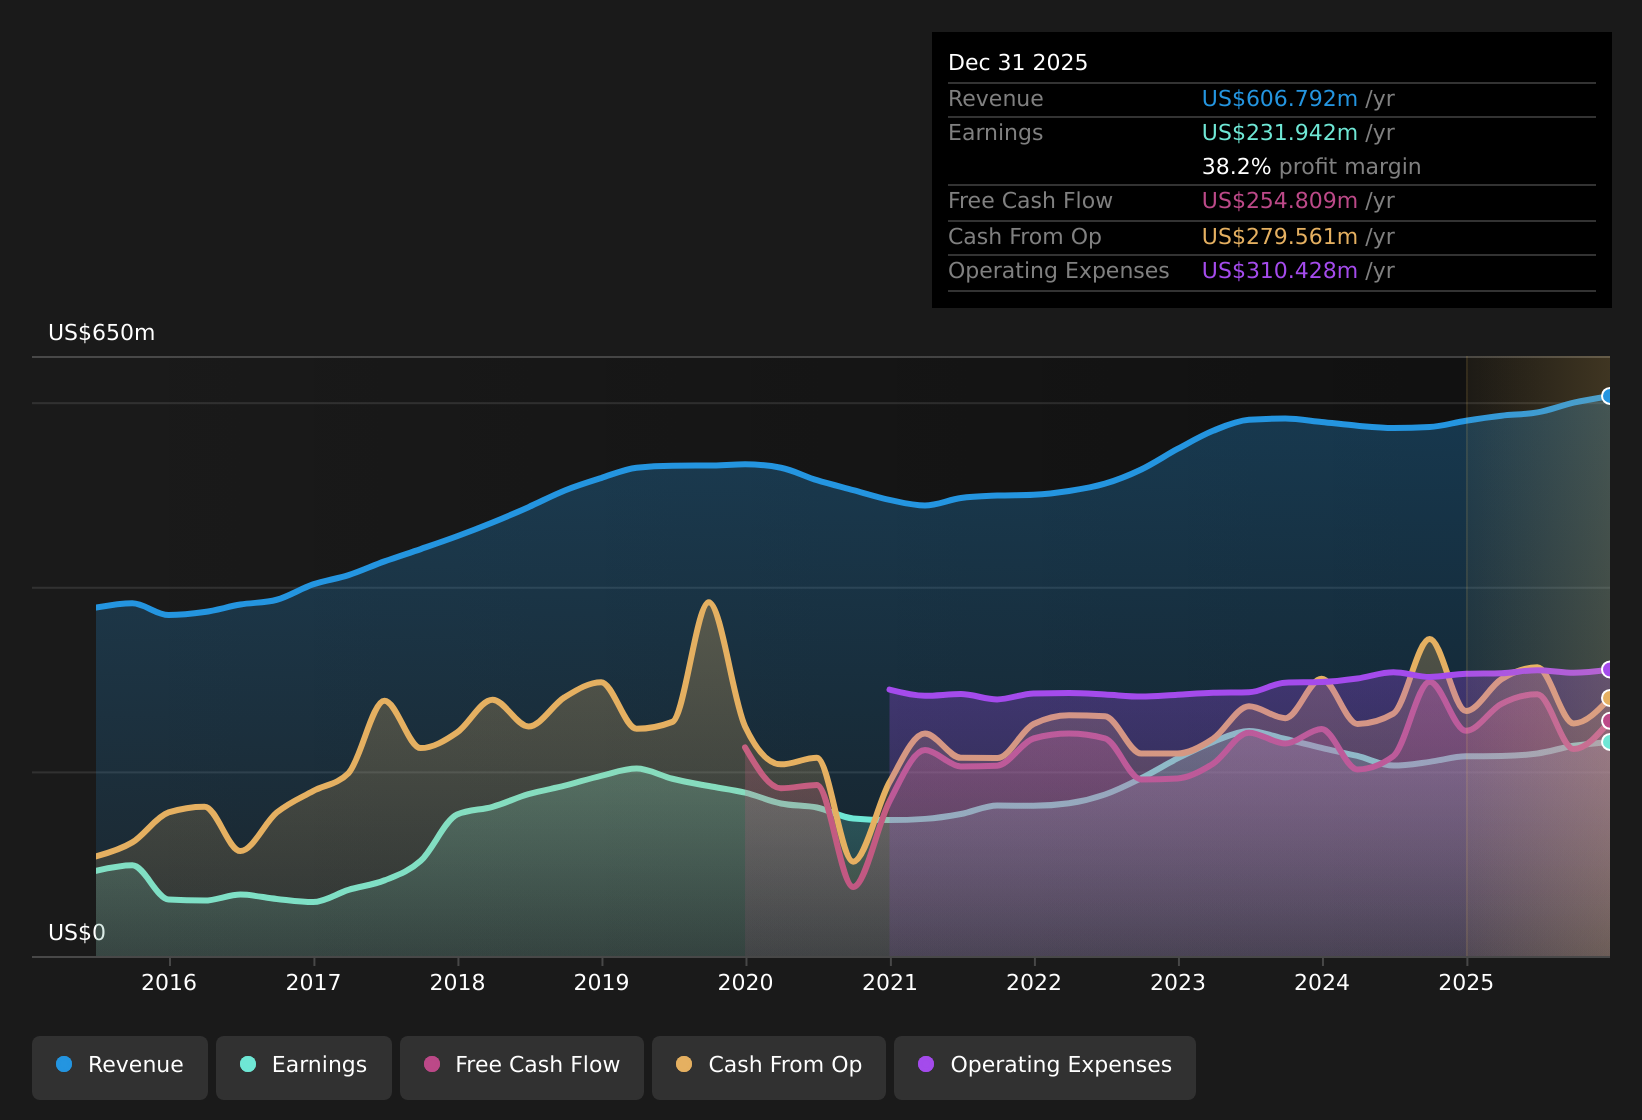
How Bank of N.T. Butterfield & Son (NYSE:NTB)'s FY 2025 Numbers Set the Stage
Bank of N.T. Butterfield & Son (NYSE:NTB) has reported a clean set of FY 2025 numbers, with fourth quarter revenue of US$159.1 million and basic EPS of US$1.58 anchoring the latest release. Over the past year, the bank has recorded trailing twelve month revenue of US$606.7 million and basic EPS of US$5.71. This gives investors a fuller picture of how the quarterly performance fits within the broader trend. With a trailing net profit margin of 38.2% and a share price around US$52.78, the focus this season is on how sustained profitability and income potential compare with emerging risks in the outlook.
See our full analysis for Bank of N.T. Butterfield & Son.With the latest results in view, the next step is to see how these numbers compare with the widely followed narratives around NTB. This highlights where the data aligns with expectations and where it challenges the prevailing consensus.
Margins Steady With 2.69% Net Interest Margin
- Net interest margin sits at 2.69% in Q4 FY 2025, with the trailing net profit margin at 38.2%, slightly above 37.3% a year earlier.
- Analysts' consensus view expects profit margins to move from around 37.3% to 32.7% over three years, and that sits in contrast with the latest period where:
- Quarterly cost to income is 57.2% in Q4 versus 61.1% back in Q2 FY 2025, which points to some recent cost control in the reported numbers.
- Net interest margin over 2025 ranged between 2.64% and 2.73%, so the current 2.69% is within that band rather than showing a sharp squeeze yet.
Credit Quality Signal From 3% Non Performing Loans
- Non performing loans are flagged at about 3% of the book over the last 12 months, with Q4 FY 2025 non performing loans at US$91.3 million compared with US$157.9 million in Q1 and US$218.5 million in Q3 FY 2024.
- Bears argue that loan quality is a weak point, and the data picks up that concern through:
- A low 19% allowance for bad loans against that 3% non performing loans ratio, which leaves a relatively small cushion if more loans sour.
- The business is also exposed to residential mortgages and hospitality linked to island economies, so any local pressure would feed directly into those non performing loan figures.
Valuation Gap With 9.2x P/E And DCF Fair Value
- On the valuation side, the trailing P/E of 9.2x sits below both the US banks industry at 12x and peers at 12.2x, while the DCF fair value in the data is US$173.84 versus a current share price of about US$52.78.
- Bulls focus on this valuation gap and long term earnings record, and the trailing figures give them material talking points:
- Five year earnings grew about 8.4% a year and trailing twelve month EPS is US$5.71, which is higher than the US$4.80 level a year ago in the data.
- The stock also pays a 3.79% dividend yield, so investors are being paid income while the market prices the shares at what the data shows as a discount to both peers and the DCF fair value.
Next Steps
To see how these results tie into long-term growth, risks, and valuation, check out the full range of community narratives for Bank of N.T. Butterfield & Son on Simply Wall St. Add the company to your watchlist or portfolio so you'll be alerted when the story evolves.
See the numbers differently. Take a fresh look at the figures, shape your own view in a few minutes, and share it with the community, Do it your way
A great starting point for your Bank of N.T. Butterfield & Son research is our analysis highlighting 4 key rewards and 3 important warning signs that could impact your investment decision.
Explore Alternatives
While NTB reports healthy profitability, the 3% non performing loans with a 19% allowance and exposure to cyclical sectors highlight credit and balance sheet risk.
If that level of loan risk gives you pause, consider companies with stronger buffers instead, and use our solid balance sheet and fundamentals stocks screener (45 results) to quickly spot them.
This article by Simply Wall St is general in nature. We provide commentary based on historical data and analyst forecasts only using an unbiased methodology and our articles are not intended to be financial advice. It does not constitute a recommendation to buy or sell any stock, and does not take account of your objectives, or your financial situation. We aim to bring you long-term focused analysis driven by fundamental data. Note that our analysis may not factor in the latest price-sensitive company announcements or qualitative material. Simply Wall St has no position in any stocks mentioned.