

Cadence Design Systems (CDNS) Stock Looks Pricey Despite Its 155% Five Year Run
Cadence Design Systems, Inc. CDNS | 0.00 |
Cadence Design Systems stock has delivered a strong 155.0% return over the past five years, yet the current checks suggest investors are now paying a premium for that track record rather than buying in at a clear discount.
- Over the last 5 years, Cadence Design Systems has returned 155.0%, which puts recent short term weakness into context as part of a much longer winning run.
- Recent headlines around AI centric partnerships in chip design and data center simulation can support high expectations, while any setback in those projects or a reset in AI related demand could pressure what already screens as a rich valuation.
- On Simply Wall St's broader valuation checks, Cadence Design Systems is assessed as expensive, scoring 0 out of 6 on value, which points to limited evidence of a bargain on traditional metrics.
The issue now is whether the quality and growth story around Cadence Design Systems is strong enough to justify paying up at these levels, or if the stock price already reflects most of that optimism.
Does Cadence Design Systems Look Pricey on Earnings?
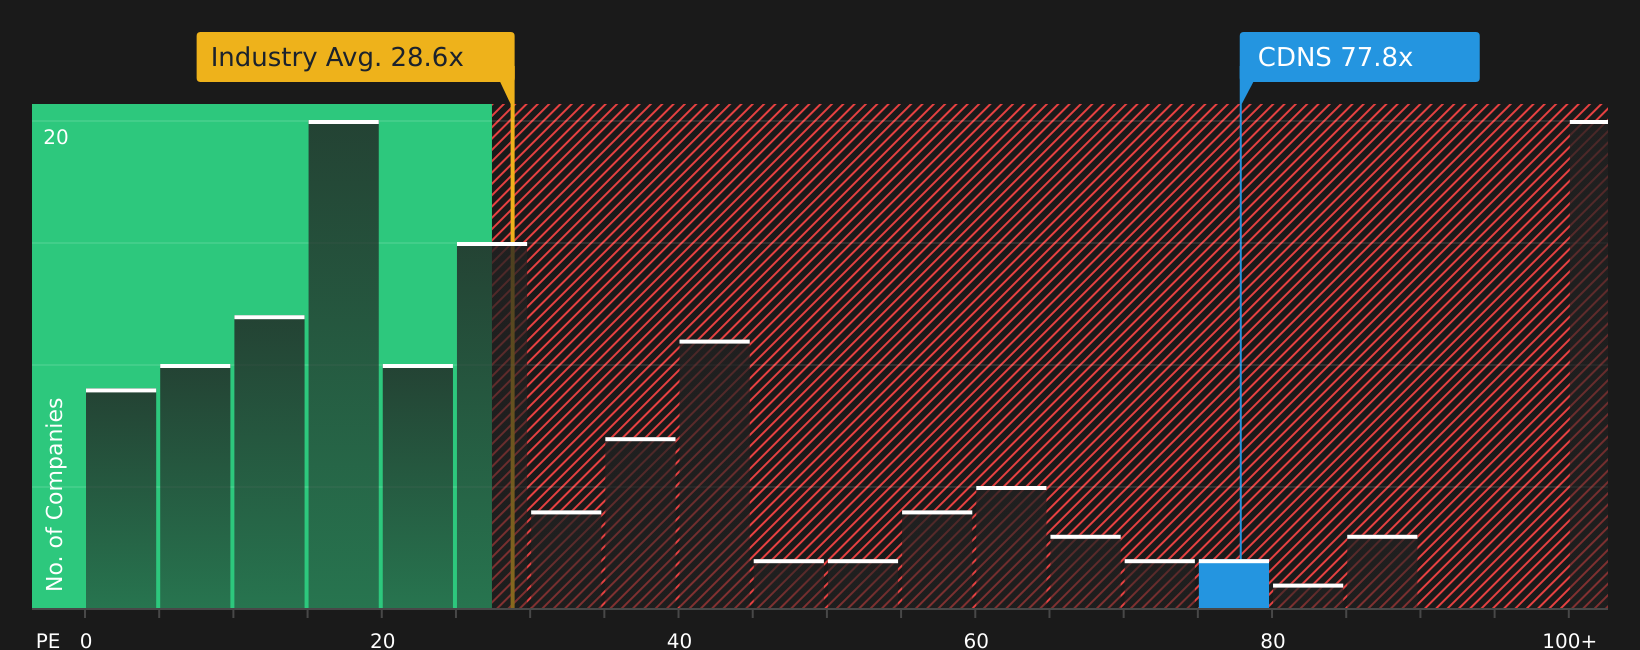
The P/E ratio is a useful way to think about what you are paying today for each dollar of Cadence Design Systems earnings. Cadence currently trades on a P/E of 85.9x, which is more than double the Software industry average of 28.8x and also well above the peer group average of 37.9x.
The Fair Ratio model, which looks at factors such as growth profile, margins, size and risk, points to a P/E of about 34.1x as a more typical level for Cadence Design Systems. That implies the current market price embeds a substantial premium to what this framework suggests, even after accounting for the AI driven partnerships and record backlog highlighted in recent news. On this P/E yardstick, Cadence Design Systems stock appears clearly overvalued.
The Cadence Design Systems Narrative: What Would Justify Today's Price?
Simply Wall St Narratives for Cadence Design Systems act as a bridge from the valuation puzzle above, explaining which paths for growth, margins and earnings would need to occur for the stock to be worth materially more or less than today's price. These narratives are available on Simply Wall St's Community page. Each narrative links its view of Cadence Design Systems' potential upside or downside to a specific perspective on where growth, profitability and risk could go next, giving you something concrete to revisit as new information becomes available.
Community views on Cadence Design Systems are split between seeing a high quality compounder at a reasonable entry point and a stock that is already priced for perfection.
Bull case: 8% undervalued
"The expanding partnership with major industry players like NVIDIA and Intel, including initiatives such as 3D-IC and data center digital twins, positions Cadence for future competitive advantages and new revenue streams..."
Bear case: 6% overvalued
"The stock is currently priced for perfection, my model accounts for a P/E contraction of roughly 1.4% to 3.4% per year..."
Do you think there's more to the story for Cadence Design Systems? Head over to our Community to see what others are saying!
The Bottom Line
For Cadence Design Systems, the current market-multiple view is clear: the stock appears overvalued on traditional earnings metrics, even after allowing for its quality profile and AI related story. That does not rule out further upside, but it means the market is already assuming a lot about how growth, margins and competitive positioning will play out.
What really separates the bull and bear cases from here is whether Cadence can deliver enough durable earnings progress to keep justifying a premium P/E, or whether expectations eventually cool and the multiple settles closer to peers.
This article by Simply Wall St is general in nature. We provide commentary based on historical data and analyst forecasts only using an unbiased methodology and our articles are not intended to be financial advice. It does not constitute a recommendation to buy or sell any stock, and does not take account of your objectives, or your financial situation. We aim to bring you long-term focused analysis driven by fundamental data. Note that our analysis may not factor in the latest price-sensitive company announcements or qualitative material. Simply Wall St has no position in any stocks mentioned.