Can Cencora (COR) Sustain Its Margin Gains While Accepting Slower Revenue Growth?
Cencora, Inc. COR | 0.00 |
- Cencora, Inc. has already reported fiscal 2026 second-quarter results, posting sales of US$78.36 billion and net income of US$1.64 billion, while slightly raising adjusted EPS guidance but trimming full-year revenue growth expectations to a 4%–6% range.
- The quarter highlighted improving profitability helped by the OneOncology acquisition and margin expansion, even as U.S. Healthcare Solutions faced headwinds from pricing pressure, customer mix shifts and slower growth in key drug categories.
- We'll now examine how Cencora's lowered revenue growth outlook, despite stronger margins, reshapes the longer-term investment narrative outlined by analysts.
Uncover the next big thing with 25 elite penny stocks that balance risk and reward.
Cencora Investment Narrative Recap
Cencora’s story still hinges on the idea that scale in pharmaceutical distribution and higher margin specialty services can offset pricing pressure and mix shifts. The immediate catalyst is how quickly the OneOncology integration and margin gains can steady sentiment after the guidance cut, while the biggest risk is that slowing U.S. Healthcare Solutions revenue from pricing and customer changes lingers longer than expected. This quarter’s reset meaningfully sharpens focus on that tension rather than changing it.
Among the recent announcements, the plan to repurchase US$1 billion of stock by the end of calendar 2026 stands out next to the lowered 4% to 6% revenue growth outlook. For investors, that combination pulls attention toward earnings quality, cash generation and balance sheet capacity as nearer term drivers of returns, even as the core long term thesis still depends on specialty drug volumes and value added services doing the heavy lifting over time.
But beneath the improved margins and buyback headline, investors should also be aware of the mounting pressure from weaker U.S. Healthcare Solutions growth and...
Cencora's narrative projects $402.2 billion revenue and $3.6 billion earnings by 2029. This requires 7.0% yearly revenue growth and about a $1.1 billion earnings increase from $2.5 billion today.
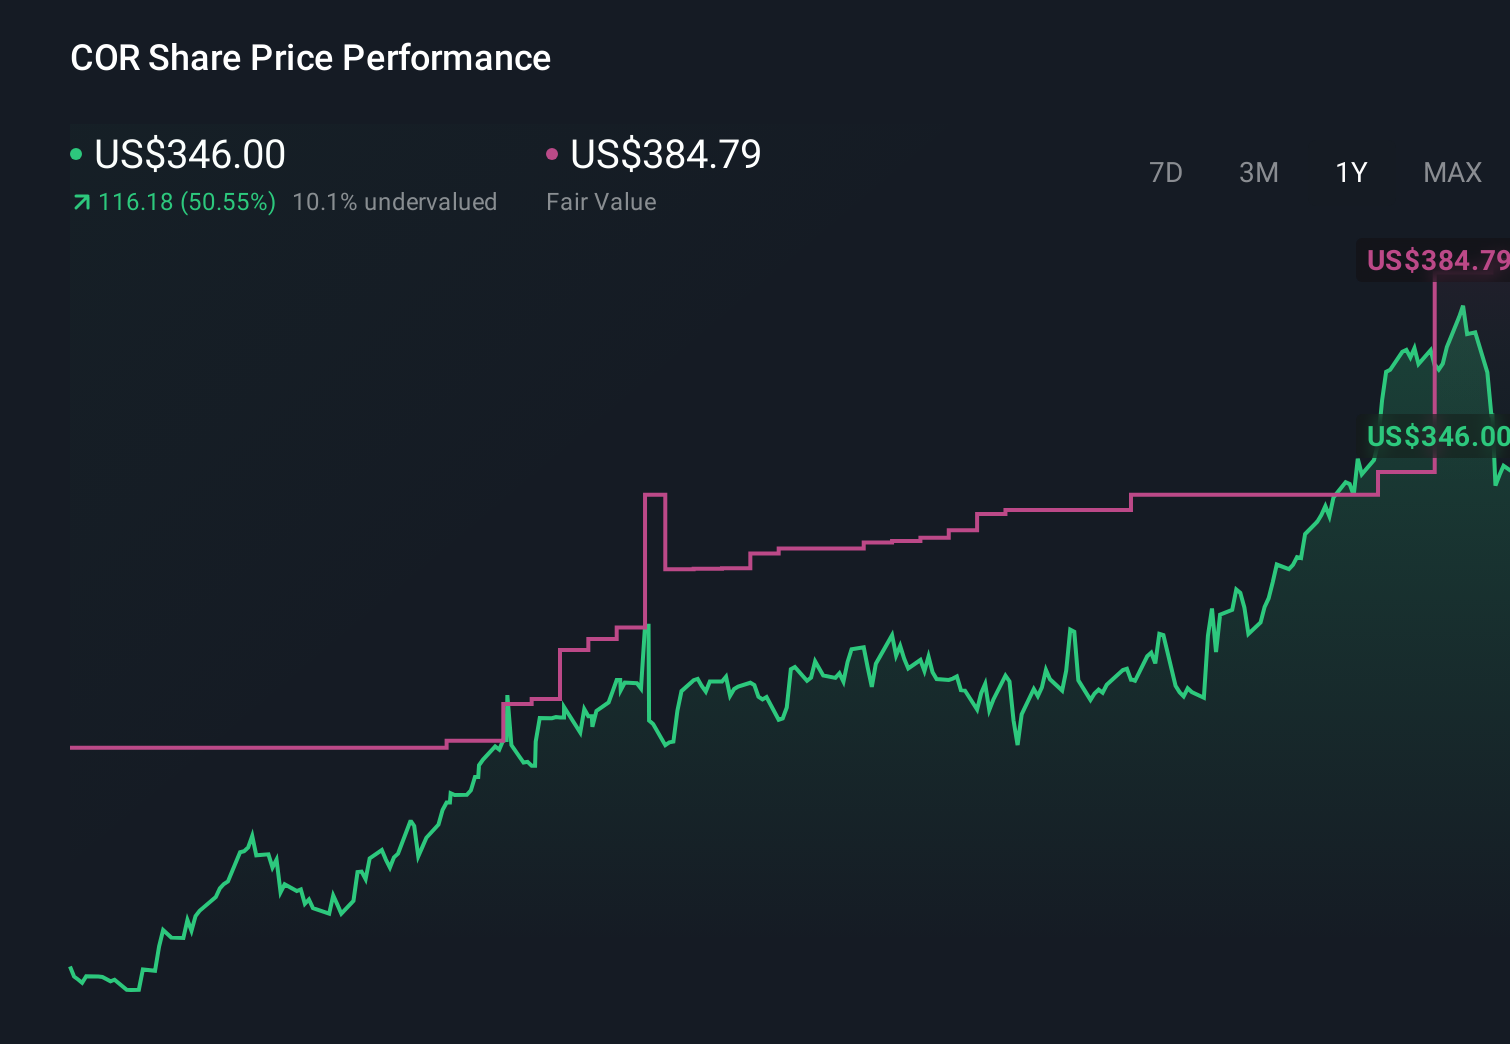
Uncover how Cencora's forecasts yield a $373.08 fair value, a 46% upside to its current price.
Exploring Other Perspectives
Some of the lowest ranked analysts were already assuming only about 4.5% yearly revenue growth and US$3.4 billion of earnings by 2029, so this softer quarter and U.S. Healthcare Solutions drag could easily push their already cautious view on integration and specialty execution further away from the more optimistic consensus you have just read.
Explore 2 other fair value estimates on Cencora - why the stock might be worth just $373.08!
Decide For Yourself
Disagree with existing narratives? Extraordinary investment returns rarely come from following the herd, so go with your instincts.
- A great starting point for your Cencora research is our analysis highlighting 5 key rewards and 1 important warning sign that could impact your investment decision.
- Our free Cencora research report provides a comprehensive fundamental analysis summarized in a single visual - the Snowflake - making it easy to evaluate Cencora's overall financial health at a glance.
Searching For A Fresh Perspective?
Our top stock finds are flying under the radar-for now. Get in early:
- Invest in the nuclear renaissance through our list of 91 elite nuclear energy infrastructure plays powering the global AI revolution.
- AI is about to change healthcare. These 35 stocks are working on everything from early diagnostics to drug discovery. The best part - they are all under $10b in market cap - there's still time to get in early.
- Explore 27 top quantum computing companies leading the revolution in next-gen technology and shaping the future with breakthroughs in quantum algorithms, superconducting qubits, and cutting-edge research.
This article by Simply Wall St is general in nature. We provide commentary based on historical data and analyst forecasts only using an unbiased methodology and our articles are not intended to be financial advice. It does not constitute a recommendation to buy or sell any stock, and does not take account of your objectives, or your financial situation. We aim to bring you long-term focused analysis driven by fundamental data. Note that our analysis may not factor in the latest price-sensitive company announcements or qualitative material. Simply Wall St has no position in any stocks mentioned.