

Can Liquidia (LQDA) Justify Its Valuation After Yutrepia Uptake And Profitable Quarters?
LIQUIDIA TECHNOLOGIES INC LQDA | 0.00 |
Liquidia (LQDA) has drawn fresh attention after being dropped from several Russell indices, even as investor focus stays on Yutrepia’s uptake, recent profitability, and the company’s expanding pulmonary hypertension pipeline.
The recent index removals came after a period of very strong momentum. Liquidia’s 30 day share price return of 31.33% contributed to a year to date share price return of 158.69%, and a 1 year total shareholder return that is very large. This suggests that investors may be reacting more to profitable quarters and Yutrepia’s uptake than to short term technical events.
If you are looking for more ideas in a similar space, this is a good moment to see what else is moving across healthcare focused AI opportunities via the 40 healthcare AI stocks.
The business looks stronger, the pipeline is fuller and Yutrepia is gaining traction, yet after Liquidia’s sharp share price move and index removals, is that progress already more than reflected in today’s valuation?
Most Popular Narrative: 12.2% Overvalued
The most followed fair value narrative for Liquidia points to a value of $72.38 per share, compared with the last close at $81.23. This frames a premium that investors need to weigh against the growth story.
Liquidia’s early uptake relies heavily on voucher and bridge programs, and if payer coverage or rebate terms are less favorable over time than management anticipates, a higher than expected gross to net adjustment could limit the translation of prescription growth into product revenue and earnings.
Want to see what is driving that valuation gap for Liquidia? The narrative leans on rapid revenue expansion, sharply higher margins, and a future earnings base that looks very different to today. Curious which assumptions really move the fair value line? The full narrative breaks down the numbers behind that $72.38 figure.
Result: Fair Value of $72.38 (OVERVALUED)
However, the Liquidia narrative also leans on assumptions around legal outcomes and Yutrepia’s voucher heavy early uptake, both of which could shift sentiment if they disappoint.
Another View: SWS DCF Points To A Very Different Fair Value
While the most popular Liquidia narrative frames the stock as 12.2% overvalued versus a $72.38 fair value, the Simply Wall St DCF model points in the opposite direction. On this view, Liquidia at $81.23 is trading about 74% below an estimated future cash flow value of $315.87 per share, a wide gap that raises questions about which set of assumptions readers find more realistic.
For a closer look at how that cash flow based estimate is built and what would need to happen for it to hold, take a moment to review the Look into how the SWS DCF model arrives at its fair value.
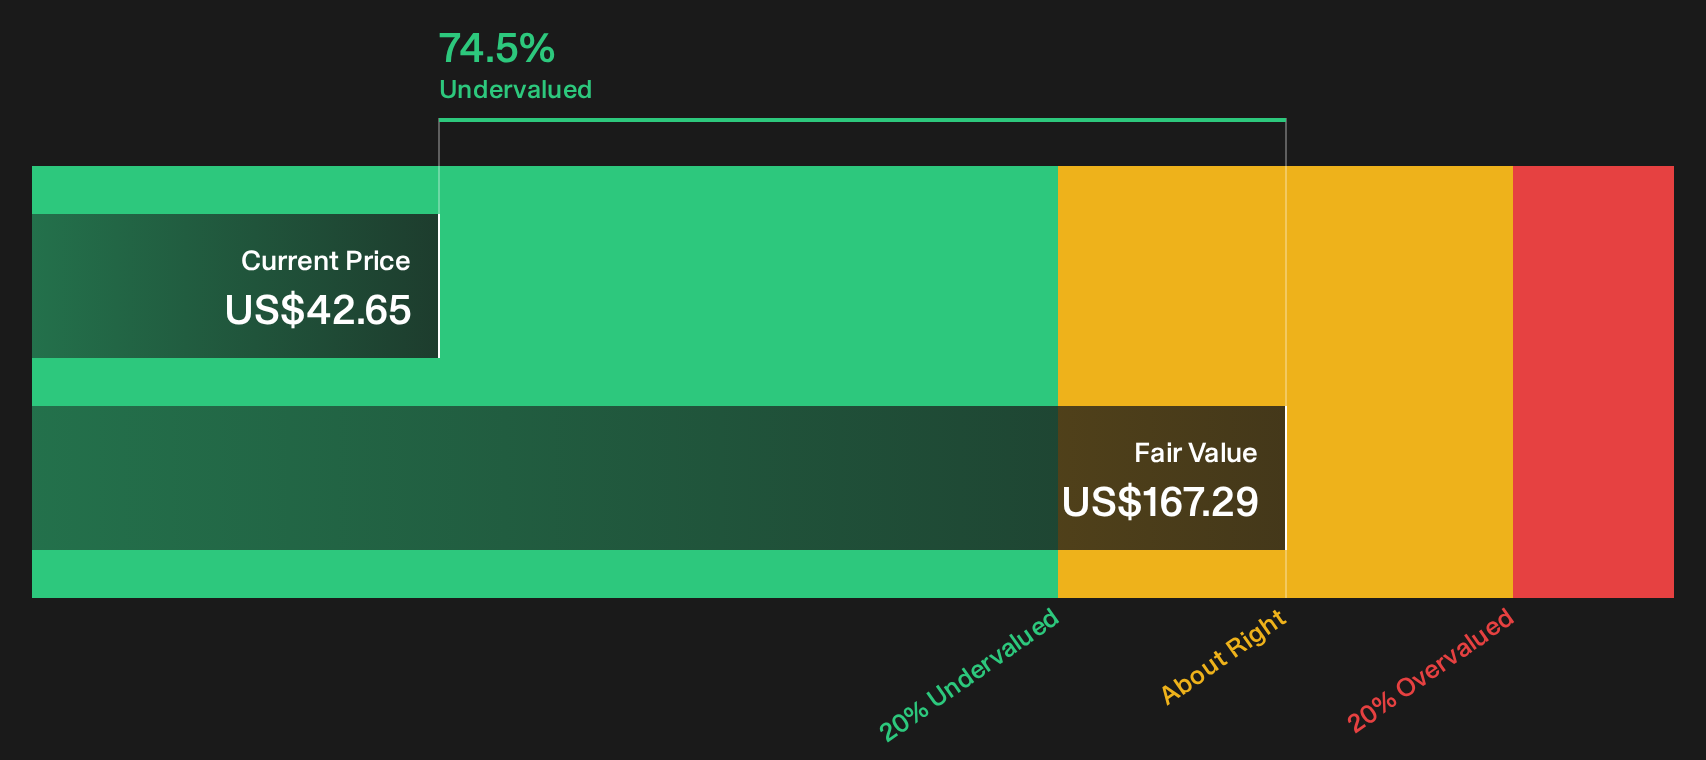
Simply Wall St performs a discounted cash flow (DCF) on every stock in the world every day (check out Liquidia for example). We show the entire calculation in full. You can track the result in your watchlist or portfolio and be alerted when this changes, or use our stock screener to discover 45 high quality undervalued stocks. If you save a screener we even alert you when new companies match - so you never miss a potential opportunity.
Next Steps
If this mix of optimism and concern around Liquidia feels familiar, consider the information while it is fresh in your mind and stress test the story against the 3 key rewards and 1 important warning sign.
Looking for more investment ideas beyond Liquidia?
Before moving on, lock in what you have learned from Liquidia and widen your watchlist with a few focused sets of stocks that match different goals.
- Target potential mispricing by scanning companies that appear to offer strong quality at appealing valuations through the 45 high quality undervalued stocks.
- Build a steadier income stream by reviewing companies with robust payout profiles using the 9 dividend fortresses.
- Add resilience to your portfolio by checking companies that score well on financial strength via the solid balance sheet and fundamentals stocks screener (47 results).
This article by Simply Wall St is general in nature. We provide commentary based on historical data and analyst forecasts only using an unbiased methodology and our articles are not intended to be financial advice. It does not constitute a recommendation to buy or sell any stock, and does not take account of your objectives, or your financial situation. We aim to bring you long-term focused analysis driven by fundamental data. Note that our analysis may not factor in the latest price-sensitive company announcements or qualitative material. Simply Wall St has no position in any stocks mentioned.