

Can Newmont (NEM) Stay Cheap After A 254% Three Year Run?
Newmont Corporation NEM | 0.00 |
Newmont stock has delivered a very large 3 year gain, yet current valuation checks show a more balanced picture, with the intrinsic value estimate pointing to roughly fair pricing while earnings based multiples lean cheaper.
- The share price has returned 253.6% over 3 years, which puts extra focus on whether recent gains already reflect the company’s fundamentals.
- Supportive gold prices and recent corporate developments such as the Jupiter Project earn in agreement and a board appointment with deep mining and finance experience can help investor confidence. At the same time, potential shifts in production levels and unit costs may limit how much value investors ascribe to future cash flows.
- On a broad set of valuation checks, Newmont scores a 3 out of 6, which points to a mixed picture rather than a clear bargain or clear overvaluation.
The issue now is whether Newmont’s recent share price strength still leaves enough valuation support for investors who are looking at the stock today.
Capitalize on the momentum in gold producers by comparing Newmont with a curated list of 33 elite gold producer stocks that share similar fundamentals and sector drivers.Does Newmont Look Fairly Valued on Cash Flow?
The Discounted Cash Flow (DCF) model estimates what Newmont might be worth based on projected future cash generation. Newmont currently produces last twelve month free cash flow of about $8.7b, which the model treats as recovering but not on an aggressive growth path over the coming decade.
On these assumptions, the DCF model points to an intrinsic value of about $127.85 per share, which is close to the current share price and implies only a 2.9% premium to fair value. Recent reports of Newmont shares rallying on strong gold prices and a board appointment help explain why the market price has moved up to roughly match the cash flow based estimate.
Overall, the DCF workup suggests Newmont stock appears roughly fairly valued on current cash flow assumptions.
Newmont is fairly valued according to our Discounted Cash Flow (DCF), but this can change at a moment's notice. Track the value in your watchlist or portfolio and be alerted on when to act.

Does Newmont Look Undervalued on Earnings?
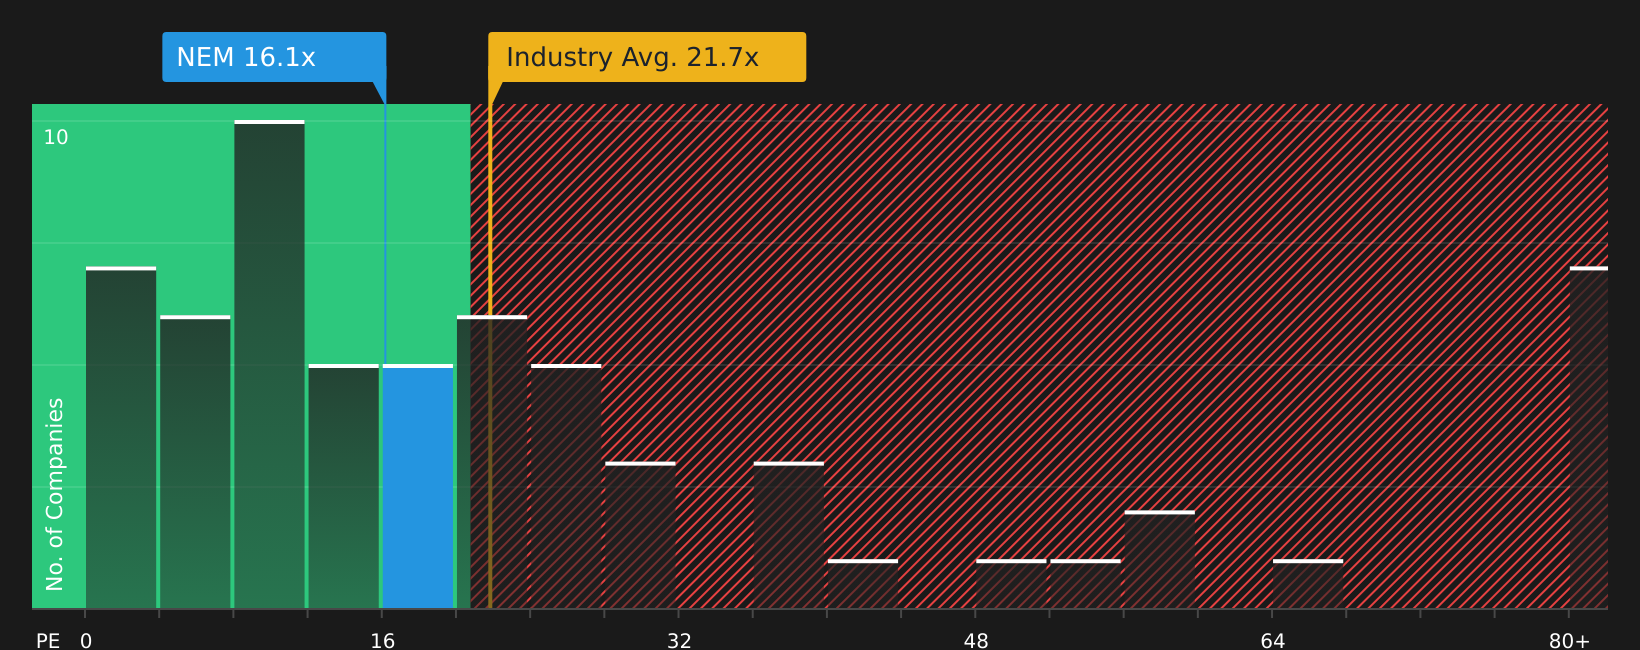
The P/E multiple is a useful cross check for Newmont because earnings are a key focus for most gold producers. Newmont currently trades on a P/E of about 16.1x, compared with an industry average of roughly 21.7x and a peer group average near 22.7x. On a simple comparison, Newmont stock trades at a discount to many other metals and mining companies.
A more tailored fair P/E for Newmont that considers its size, margins and risk profile is estimated at about 24.1x. That is meaningfully above the current 16.1x, which signals that the market is pricing Newmont below what this framework suggests for its earnings power.
Taken together, the P/E workup indicates Newmont appears undervalued on earnings compared with both peers and its own fair multiple.
The Newmont Narrative: What Would Justify Today's Price?
Simply Wall St Narratives pick up where Newmont's valuation puzzle leaves off. They explain which potential future paths for Newmont's growth, margins and earnings would need to occur for the stock to be worth materially more or materially less than it is today. Each narrative presents a fair value as a thesis about Newmont's business that you can revisit over time, rather than as a single snapshot, and they are available on Simply Wall St's Community page.
Community views on Newmont are sharply split, with one camp seeing solid cash generation support and another focused on cost and demand risks.
Bull case: roughly fairly valued
"The realization of synergies and increased production scale following the Newcrest Mining acquisition, together with ongoing asset optimization and the ramp-up of expansion projects, should support long-term revenue growth and cash flow stability..."
Bear case: 56% overvalued
"Compounded by ongoing depletion of economically viable reserves, Newmont will be forced to develop more lower-grade, higher-cost deposits, leading to a structural rise in all-in sustaining costs, which compresses operating and net margins even in periods of stable or rising metal prices..."
Do you think there's more to the story for Newmont? Head over to our Community to see what others are saying!
The Bottom Line
For Newmont, the Discounted Cash Flow (DCF) work suggests the stock now trades close to intrinsic value, so the easy upside from cash flow mispricing looks limited. The earnings multiples tell a different story and point to Newmont trading at a discount to peers and to its own tailored fair P/E. That split comes down to whether the market is underestimating Newmont's earnings power or correctly pricing in execution and cost risks. The key question from here is whether margins and project delivery are strong enough to support a sustained re rating of the P/E without undermining the current cash flow profile.
This article by Simply Wall St is general in nature. We provide commentary based on historical data and analyst forecasts only using an unbiased methodology and our articles are not intended to be financial advice. It does not constitute a recommendation to buy or sell any stock, and does not take account of your objectives, or your financial situation. We aim to bring you long-term focused analysis driven by fundamental data. Note that our analysis may not factor in the latest price-sensitive company announcements or qualitative material. Simply Wall St has no position in any stocks mentioned.