Canadian Solar (NasdaqGS:CSIQ) Valuation Check After US$200 Million Convertible Notes For U.S. Manufacturing Expansion
Canadian Solar Inc. CSIQ | 13.36 | -2.05% |
Why Canadian Solar’s new convertible notes matter for shareholders
Canadian Solar (NasdaqGS:CSIQ) has completed and priced a US$200 million offering of 3.25% senior unsecured convertible notes due 2031. The proceeds are earmarked for U.S. manufacturing, battery energy storage projects, solar initiatives, and general corporate use.
The new US$200 million convertible notes come after a sharp 23.73% 7 day share price decline and a 14.44% 30 day share price return, even as the 90 day share price return is 36.58% and the 1 year total shareholder return is 58.72%. This points to longer term momentum contrasting with recent weakness as investors reassess both growth potential and risk ahead of Canadian Solar’s expanded U.S. manufacturing and battery storage plans.
If you are comparing Canadian Solar with other clean energy names, this could be a useful moment to see which peers in tech heavy renewables stand out through high growth tech and AI stocks.
With Canadian Solar trading at US$19.38 and showing mixed returns across different timeframes, along with an intrinsic discount of roughly 5%, the real question is whether markets are overlooking future upside or already pricing in growth.
Most Popular Narrative: 16.9% Undervalued
With Canadian Solar last closing at US$19.38 against an implied fair value of about US$23.33, the most followed narrative sees meaningful upside baked into its long range storage and solar build out.
The company's forward integration into battery storage, with plans to expand BESS manufacturing capacity from 10 GWh to 24 GWh by 2026 and battery cell capacity from 3 GWh to 9 GWh, positions Canadian Solar to capture higher-margin business and increase average order value, positively impacting future net margins and earnings.
Curious what sits behind that higher margin story and higher fair value? It rests on specific revenue ramps, margin shifts, and a future earnings multiple that might surprise you. The full narrative lays out each assumption and how they stack together for that US$23.33 figure.
Result: Fair Value of $23.33 (UNDERVALUED)
However, this higher fair value story still hinges on policy and trade questions, with U.S. tax credit changes and tariff actions both potential spoilers.
Another Way To Look At Value
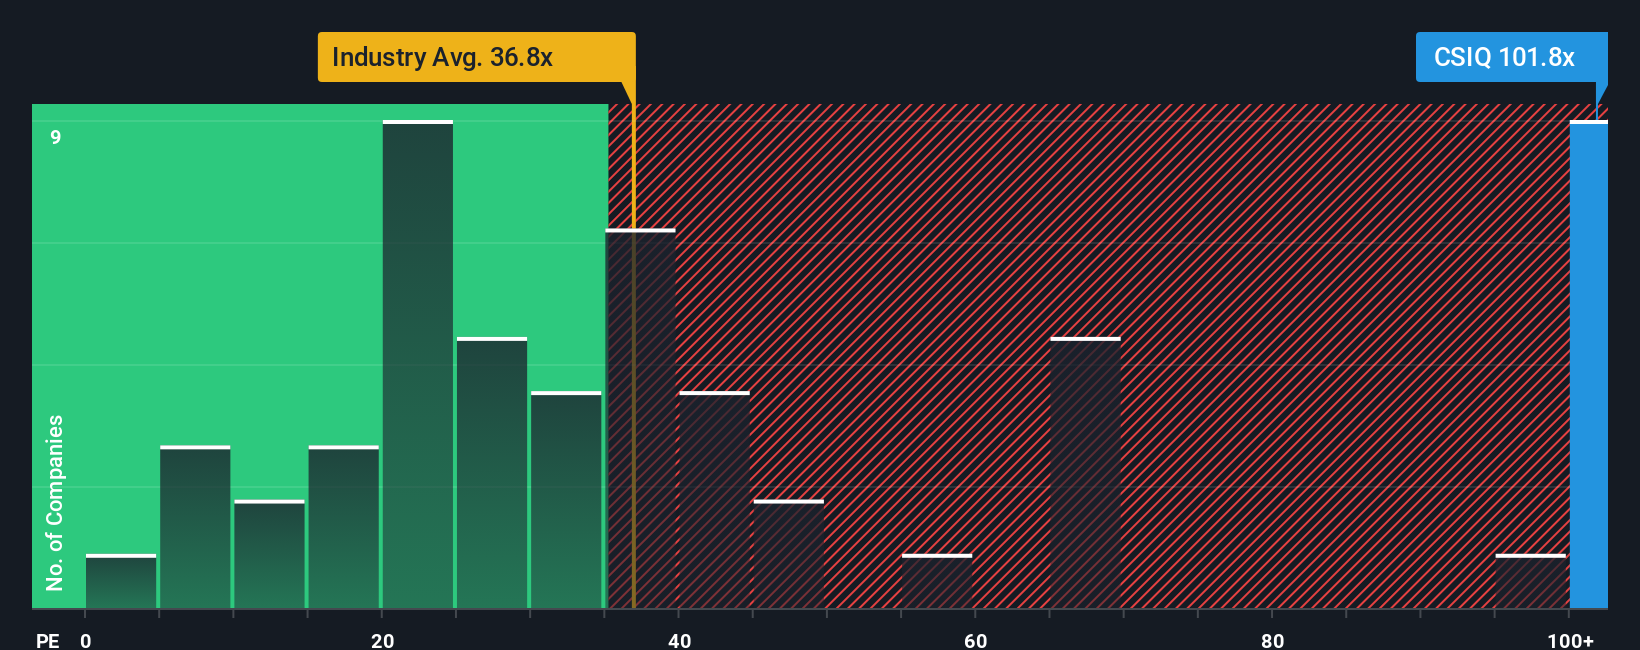
That 16.9% upside story sits next to a very different message from earnings based valuation. Canadian Solar trades on a P/E of 80.5x, compared with 61.1x across peers and 42x for the wider US Semiconductor group. Our fair ratio estimate is 140.5x.
This wide gap suggests the market is already paying a rich price relative to peers, yet the valuation is still below where the fair ratio indicates it could move. For you, the real question is whether that spread signals upside that is simply out of favor today, or valuation risk if sentiment cools.
Build Your Own Canadian Solar Narrative
If you look at the numbers and come to a different conclusion, or simply want your own view backed by the same data, you can build a fresh narrative yourself in just a few minutes by starting with Do it your way.
A great starting point for your Canadian Solar research is our analysis highlighting 3 key rewards and 3 important warning signs that could impact your investment decision.
Looking for more investment ideas?
If Canadian Solar has caught your attention, do not stop there. Use data driven stock ideas to pressure test your thinking and widen your opportunity set.
- Spot potential turnaround plays early by scanning these 3539 penny stocks with strong financials that pair lower share prices with stronger financials than you might expect.
- Ride powerful tech trends by checking out these 28 AI penny stocks that link artificial intelligence themes with higher risk or reward profiles.
- Hunt for pricing gaps by reviewing these 882 undervalued stocks based on cash flows that screen for companies trading below their estimated cash flow based worth.
This article by Simply Wall St is general in nature. We provide commentary based on historical data and analyst forecasts only using an unbiased methodology and our articles are not intended to be financial advice. It does not constitute a recommendation to buy or sell any stock, and does not take account of your objectives, or your financial situation. We aim to bring you long-term focused analysis driven by fundamental data. Note that our analysis may not factor in the latest price-sensitive company announcements or qualitative material. Simply Wall St has no position in any stocks mentioned.