

CBAK Energy Technology Joins 2 Other Compelling Penny Stocks
CBAK Energy Technology, Inc. CBAT | 0.00 |
The market has climbed 2.2% in the last 7 days and is up 21% over the past year, with earnings forecast to grow by 17% annually. Though the term 'penny stock' might sound like a relic of past trading days, these smaller or newer companies can still offer surprising value when built on solid financials. In this article, we explore three penny stocks that combine balance sheet strength with potential for outsized gains, offering investors a chance to discover hidden value in quality companies.
Here we highlight a subset of our preferred stocks from the screener.
CBAK Energy Technology (CBAT)
Simply Wall St Financial Health Rating: ★★★★☆☆
Overview: CBAK Energy Technology Limited, along with its subsidiaries, focuses on the manufacturing, commercialization, and distribution of lithium-ion and sodium-ion rechargeable batteries, with a market cap of $57.83 million.
Operations: The company generates revenue primarily from its segments: CBAT, contributing $123.14 million, and Hitrans, adding $106.73 million.
Market Cap: $57.83M
CBAK Energy Technology, with a market cap of US$57.83 million, is focused on lithium-ion and sodium-ion battery production. Despite its unprofitability, the company maintains a satisfactory net debt to equity ratio of 35.2% and has sufficient cash runway for over three years due to positive free cash flow growth. Recent developments include progress in customer testing for new high-rate cylindrical cells aimed at AI data center backup applications, which show promising performance metrics. However, CBAK faces challenges such as volatile share prices and increasing debt levels over the past five years while remaining unprofitable with growing losses.

Clarus (CLAR)
Simply Wall St Financial Health Rating: ★★★★★☆
Overview: Clarus Corporation designs, develops, manufactures, and distributes outdoor equipment and lifestyle products across various international markets, with a market cap of approximately $142.05 million.
Operations: The company generates revenue from its Outdoor segment, which accounts for $180.53 million, and its Adventure segment, contributing $72.33 million.
Market Cap: $142.05M
Clarus Corporation, with a market cap of US$142.05 million, has shown recent financial improvements, reporting a net income of US$4.71 million for Q2 2026 compared to a loss the previous year. The company maintains strong short-term asset coverage over liabilities and is debt-free, providing financial stability. Despite this progress, Clarus remains unprofitable overall and faces challenges in achieving profitability within the next three years. Recent index exclusions could impact investor sentiment; however, ongoing share buybacks and consistent dividend payments reflect management's confidence in its operations amidst volatility in earnings growth and return on equity concerns.
Caesarstone (CSTE)
Simply Wall St Financial Health Rating: ★★★★★★
Overview: Caesarstone Ltd. designs, develops, manufactures, and sells engineered stone and porcelain products globally under various brands, with a market cap of $79.53 million.
Operations: The company generates revenue of $381.81 million from its building products segment.
Market Cap: $79.53M
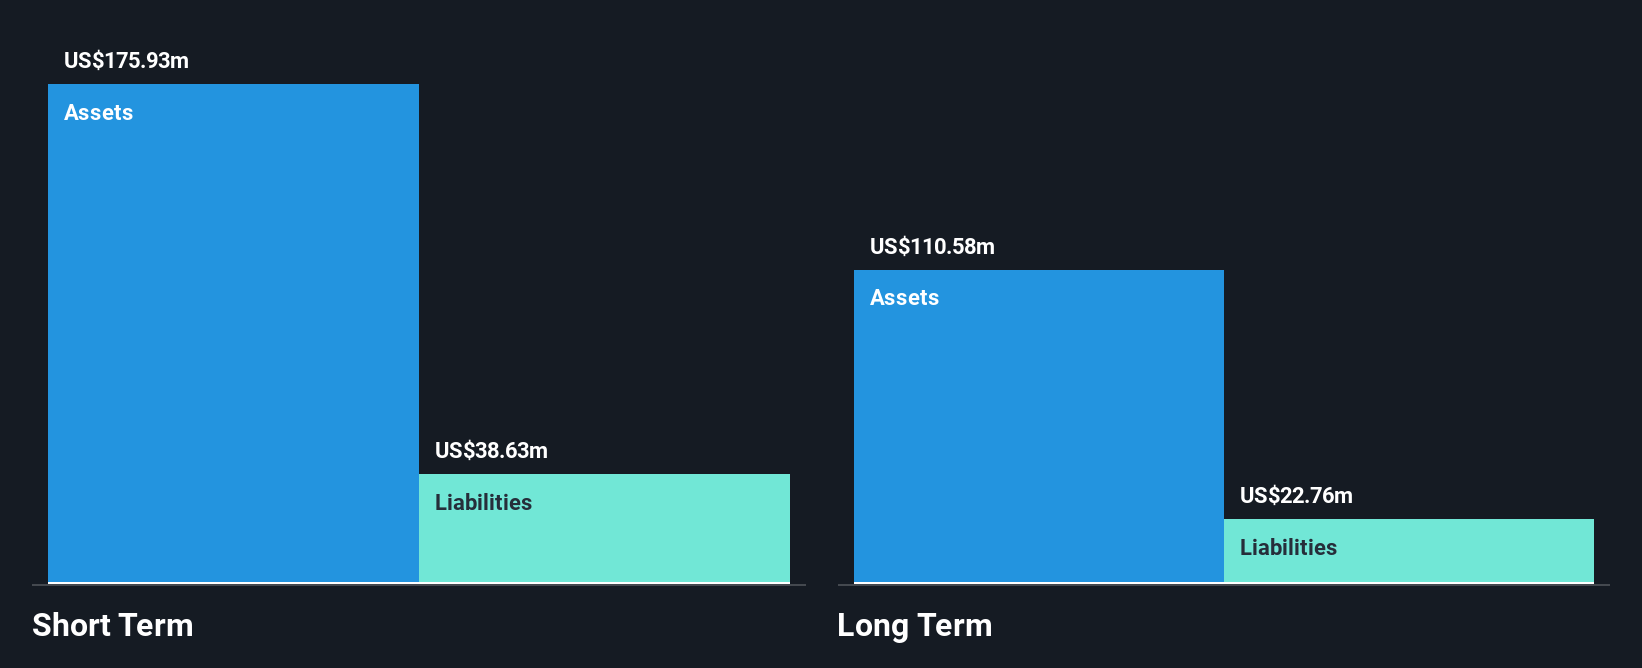
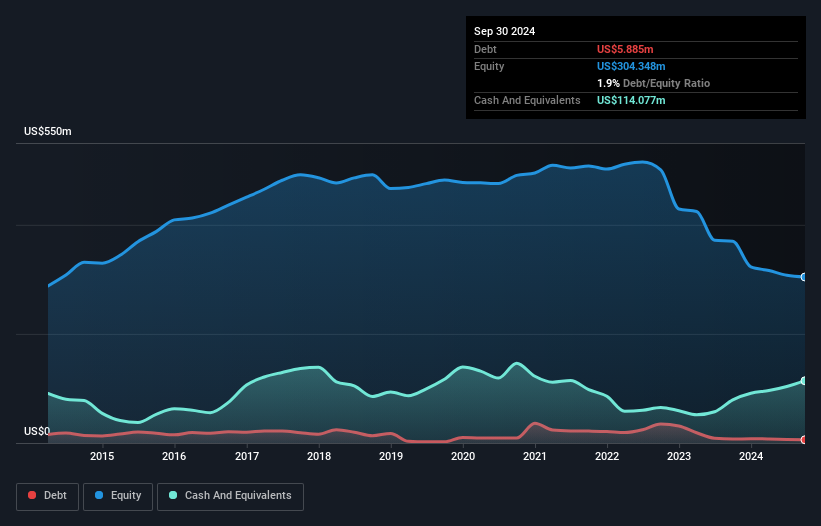
Caesarstone Ltd., with a market cap of US$79.53 million, faces challenges as it remains unprofitable, reporting a net loss of US$15.57 million for Q2 2026 despite reducing losses from the previous year. The company generates substantial revenue, US$381.81 million annually, but earnings have declined significantly over the past five years. Caesarstone's short-term assets cover both its short and long-term liabilities, indicating some financial resilience despite ongoing losses and negative return on equity. Recent earnings announcements highlight declining sales and continued net losses, while a recent shelf registration filing suggests potential capital-raising efforts amid cash runway concerns.
Taking Advantage
- Unlock more gems! Our US Penny Stocks screener has unearthed 324 more companies for you to explore.Click here to unveil our expertly curated list of 327 US Penny Stocks.
- Contemplating Other Strategies? We've found 9 US stocks that are forecast to pay a dividend yeild of over 6% next year. See the full list for free.
This article by Simply Wall St is general in nature. We provide commentary based on historical data and analyst forecasts only using an unbiased methodology and our articles are not intended to be financial advice. It does not constitute a recommendation to buy or sell any stock, and does not take account of your objectives, or your financial situation. We aim to bring you long-term focused analysis driven by fundamental data. Note that our analysis may not factor in the latest price-sensitive company announcements or qualitative material. Simply Wall St has no position in any stocks mentioned.