CF Bankshares (CFBK) Net Margin Above 32% Challenges Long Term Earnings Decline Narrative
CF Bankshares Inc CFBK | 29.16 | -0.68% |
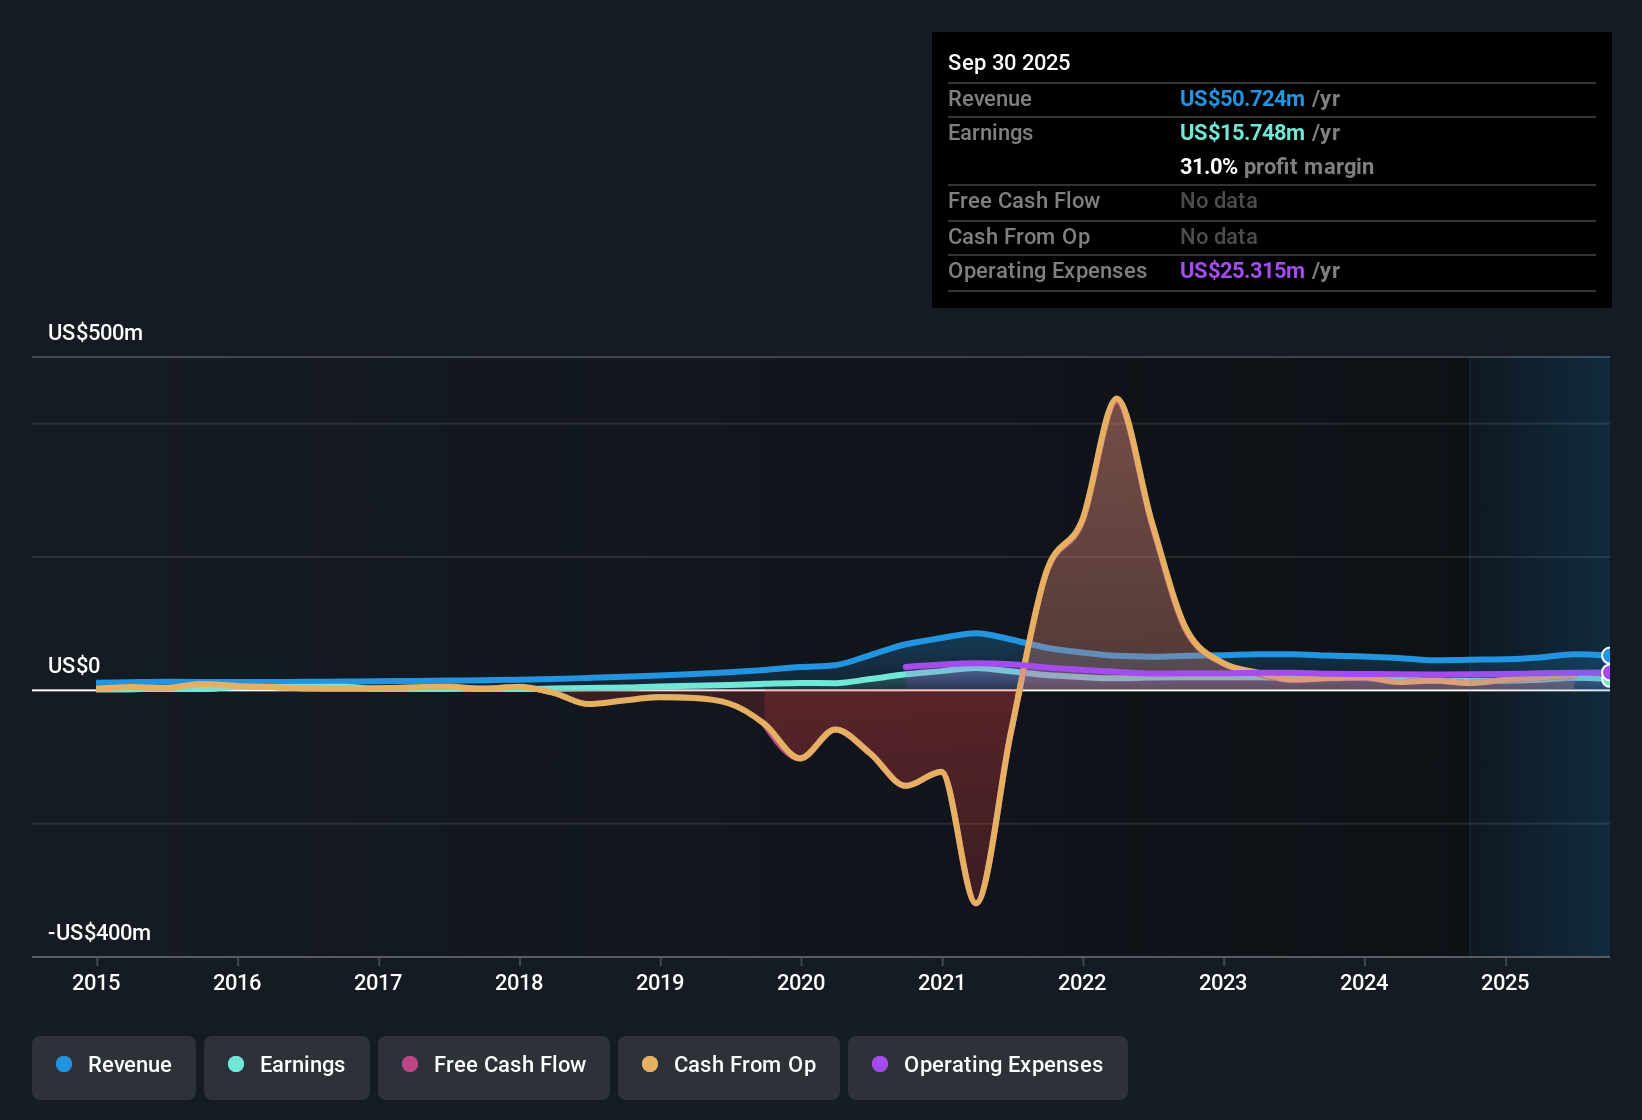
CF Bankshares (CFBK) has rounded out FY 2025 with fourth quarter total revenue of US$14.6 million and basic EPS of US$0.89, supported by trailing twelve month revenue of US$52.7 million and EPS of US$2.70 against a current share price of US$33.31. Over the past few reporting periods, the company has seen quarterly revenue move from US$12.6 million in Q4 2024 to US$13.5 million in Q1 2025, US$14.2 million in Q2 2025, US$10.4 million in Q3 2025, and US$14.6 million in Q4 2025. Basic EPS has ranged from US$0.69 to US$0.89 across the same stretch, creating a results picture in which margins and earnings quality sit at the center of the story for investors.
See our full analysis for CF Bankshares.With the latest numbers on the table, the next step is to line them up against the most widely held narratives about CF Bankshares to see which stories the results support and which ones they call into question.
Net profit margin holds above 32%
- On a trailing twelve month basis, CF Bankshares booked US$17.0 million of net income on US$52.7 million of revenue, which works out to a 32.3% net profit margin compared with 28.9% a year earlier.
- What stands out for a bullish view is that this 32.3% margin comes alongside FY 2025 TTM EPS of US$2.70. Supporters can point to both higher profitability and earnings of US$17.0 million, while skeptics may focus on the fact that five year earnings still declined at about 12.9% per year, which sits in clear contrast to the stronger recent margin.
Lending book steady, credit quality mixed
- Total loans stayed in a fairly tight range between US$1.73b and US$1.77b over the last six reported quarters, while non performing loans moved between US$10.0 million and US$16.6 million. This gives a sense of how credit quality has shifted around that stable book size.
- Investors who worry about a bearish angle on credit risk may flag that non performing loans were US$16.6 million in Q2 2025 before easing to US$10.0 million in Q3 2025. The recent improvement in that figure and the bank’s ability to earn US$4.88 million and US$2.27 million of quarterly net income through those periods gives a more balanced picture than a simple one way credit stress story suggests.
Valuation multiples and DCF gap
- At a share price of US$33.31, CF Bankshares trades on a trailing P/E of 12.6x, close to the US Banks industry average of 12x and well below the peer average of 27.6x, while also sitting about 30.9% below a DCF fair value of roughly US$48.20.
- Supporters of a bullish stance often point to this combination of a 12.6x P/E, 30.5% trailing earnings growth and the DCF fair value of US$48.20 as evidence that recent profitability and the pricing gap line up. Yet the five year earnings decline of 12.9% per year is an explicit counterpoint for more cautious investors who question how long the current earnings strength can last.
Some investors like to cross check numbers like the 12.6x P/E and the US$48.20 DCF fair value against a fuller story of growth, risks, and peer comparisons, and Curious how numbers become stories that shape markets? Explore Community Narratives can help you see how different market participants connect those dots.
Next Steps
Don't just look at this quarter; the real story is in the long-term trend. We've done an in-depth analysis on CF Bankshares's growth and its valuation to see if today's price is a bargain. Add the company to your watchlist or portfolio now so you don't miss the next big move.
See What Else Is Out There
Even with a 32.3% net margin and a P/E of 12.6x, the five year earnings decline of about 12.9% per year raises a clear question about consistency.
If that long term earnings pressure makes you prefer companies with more stable profit profiles, you may want to explore 53 high quality undervalued stocks that combine lower valuations with stronger underlying fundamentals and see what alternatives stand out today.
This article by Simply Wall St is general in nature. We provide commentary based on historical data and analyst forecasts only using an unbiased methodology and our articles are not intended to be financial advice. It does not constitute a recommendation to buy or sell any stock, and does not take account of your objectives, or your financial situation. We aim to bring you long-term focused analysis driven by fundamental data. Note that our analysis may not factor in the latest price-sensitive company announcements or qualitative material. Simply Wall St has no position in any stocks mentioned.