Charts Analysis: The 3 Most Common And Profitable Chart Patterns
S&P 500 index SPX | 0.00 | |
Tadawul All Shares Index TASI.SA | 0.00 | |
NASDAQ IXIC | 0.00 | |
Dow Jones Industrial Average DJI | 0.00 | |
NextEra Energy, Inc. NEE | 0.00 |
When you're new to stock investing and learning to read stock charts, focus on three main patterns.
While other base patterns exist, these three are the most common and have consistently delivered strong gains across every market cycle.
By using stock charts to spot these bases, you can buy and watch the best stocks early.
The three common chart patterns and their buy points:
- Cup with Handle & Cup without Handle
- Double Bottom
- Flat Base
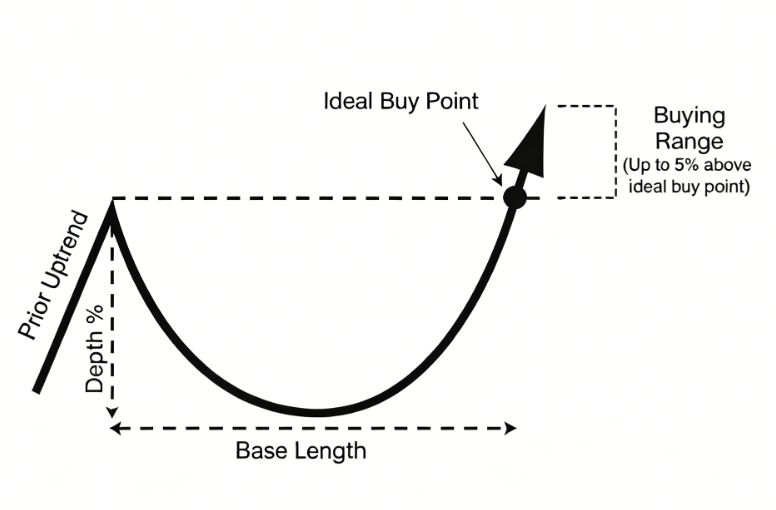
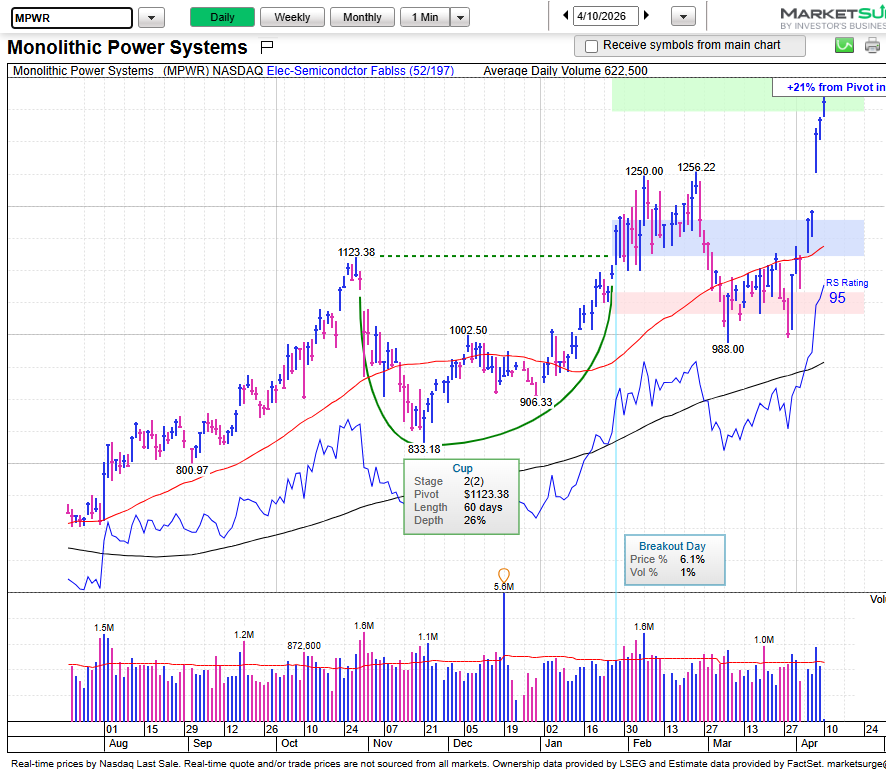
1. Cup with Handle
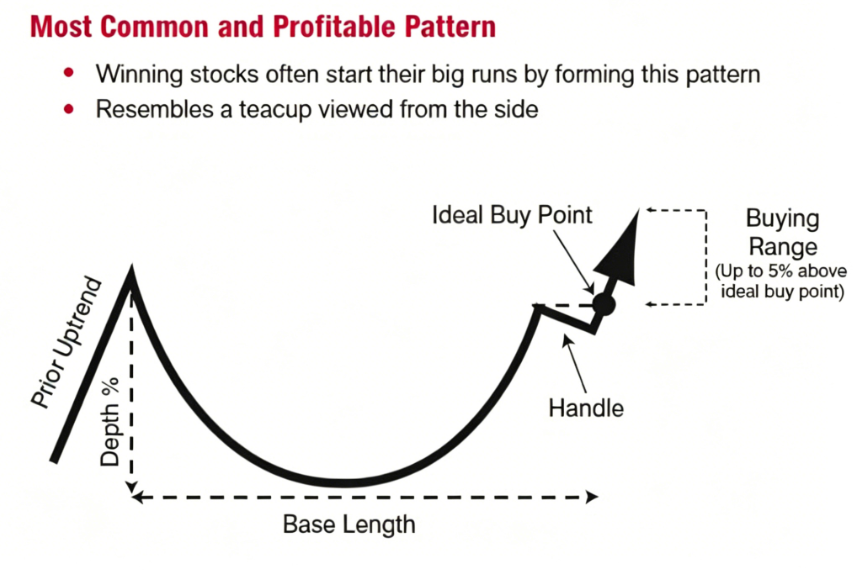
Prior uptrend of at least 30% – A stock needs an uptrend before forming a base. The base allows the stock to digest gains and build support for a higher climb.
Base depth: 15%-30% – Measured from the left peak to the lowest point. In severe bear markets, depth can reach 40%-50%. All else equal, a stock with a shallower base (e.g., 20% vs. 35%) is often forming a more stable pattern.
Base length: at least 7 weeks – The first down week counts as Week 1. Be wary of patterns lasting only 5 weeks; that's usually not enough time for proper consolidation.
The handle – Forms in the upper half of the cup, pulling back slightly (depth of 10%-12% of the cup). It shakes out weak holders. A drop over 12%-15% on heavy volume may signal trouble.
Buy point – The ideal entry is when the stock breaks above the handle's peak on volume at least 40%-50% above average. Avoid buying more than 5% above the ideal buy point.
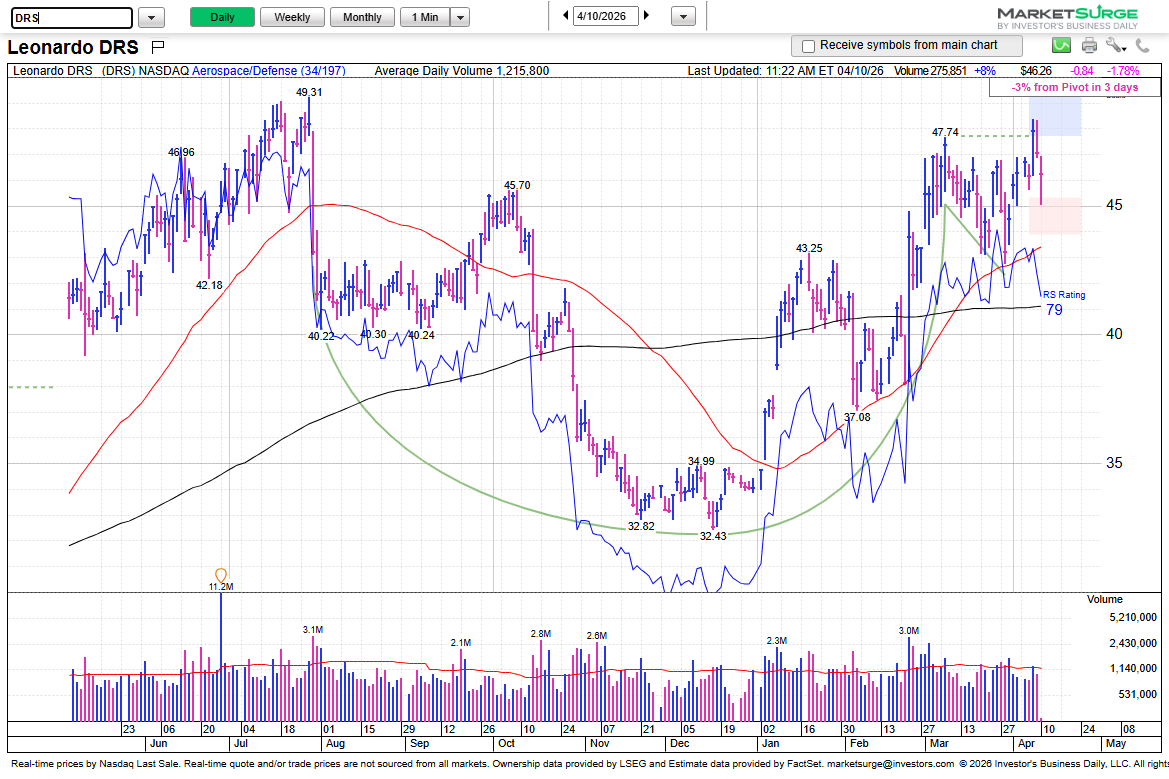
Cup without Handle – Same as cup with handle, but without the handle. The buy point is the left-side peak (resistance area).
2. Double Bottom
Often forms during volatile market conditions. The pattern reflects this: a decline, a rebound attempt that fails, a second decline, then a final breakout.
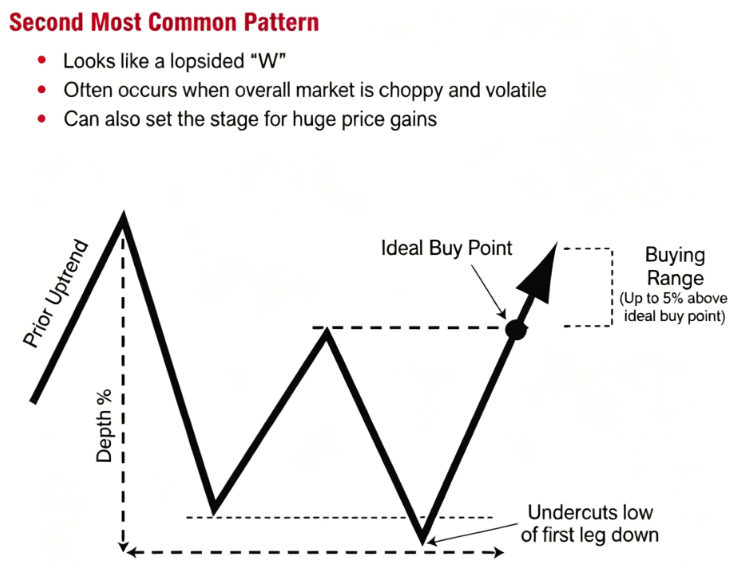
Key features:
Prior uptrend: 30% or more
Base depth: 40% or less
Base length: at least 7 weeks
The middle peak (W shape) should be in the upper half of the base, below the left peak
Undercut: The second low should go slightly below the first low
Buy point: The middle peak (within 5% above)
Breakout volume: at least 40%-50% above average
The undercut shakes out weak holders, leaving stronger hands to support the next advance.
3. Flat Base
Typically forms after a stock has already had a big run from a cup or double bottom. These are often second-stage bases.
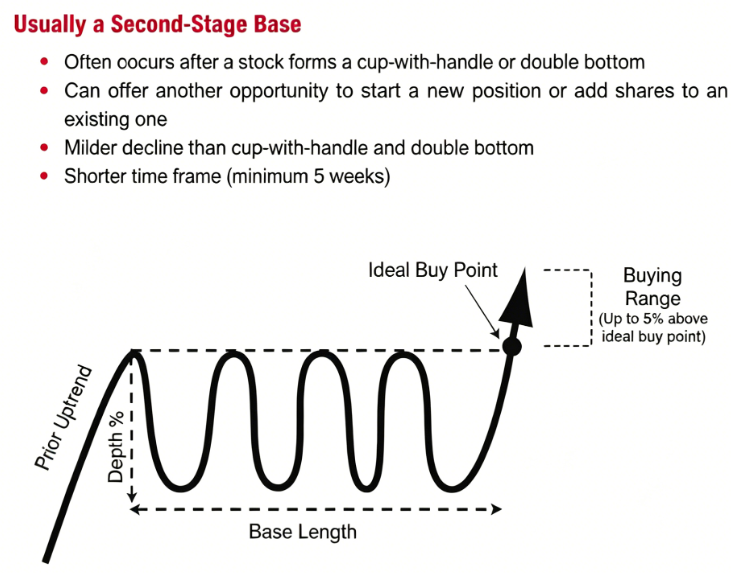
Key features:
Prior uptrend: 30% or more
Base depth: 15% or less (much shallower than other patterns)
Base length: at least 5 weeks
Price action: Mostly horizontal, narrow trading range – institutions accumulate without pushing price higher
Buy point: The highest price in the base (within 5% above)
Breakout volume: at least 40%-50% above average
Instead of sharp selling, the flat base wears out weak holders through a slow, sideways grind, causing them to lose patience and sell.
Important Reminders for All Patterns
Buy at the right time – Aim to buy as close to the ideal buy point as possible.
Don't chase – Avoid buying more than 5% above the buy point.
Watch for pullbacks – Stocks often pull back slightly after a breakout. If you bought too much, a small dip could trigger your stop-loss.
Volume confirms strength – Heavy volume on breakout day (at least 40%-50% above average) signals strong institutional buying. Volume spikes of 100%, 200% or more are even better.
Use both daily and weekly charts – Weekly charts show the long-term trend; daily charts show the exact breakout day action.
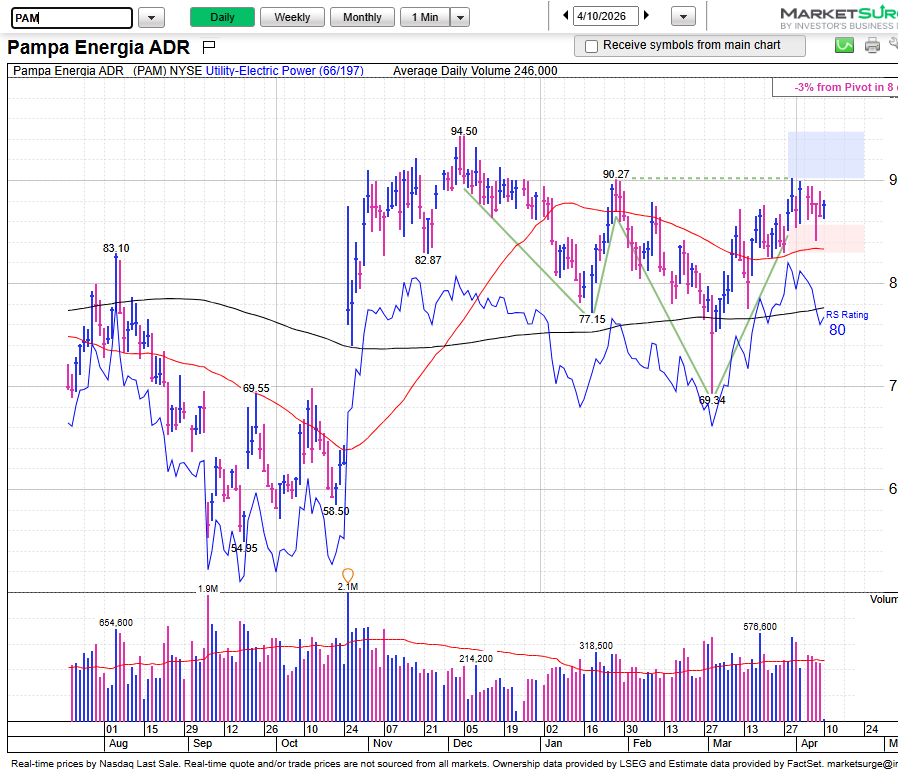
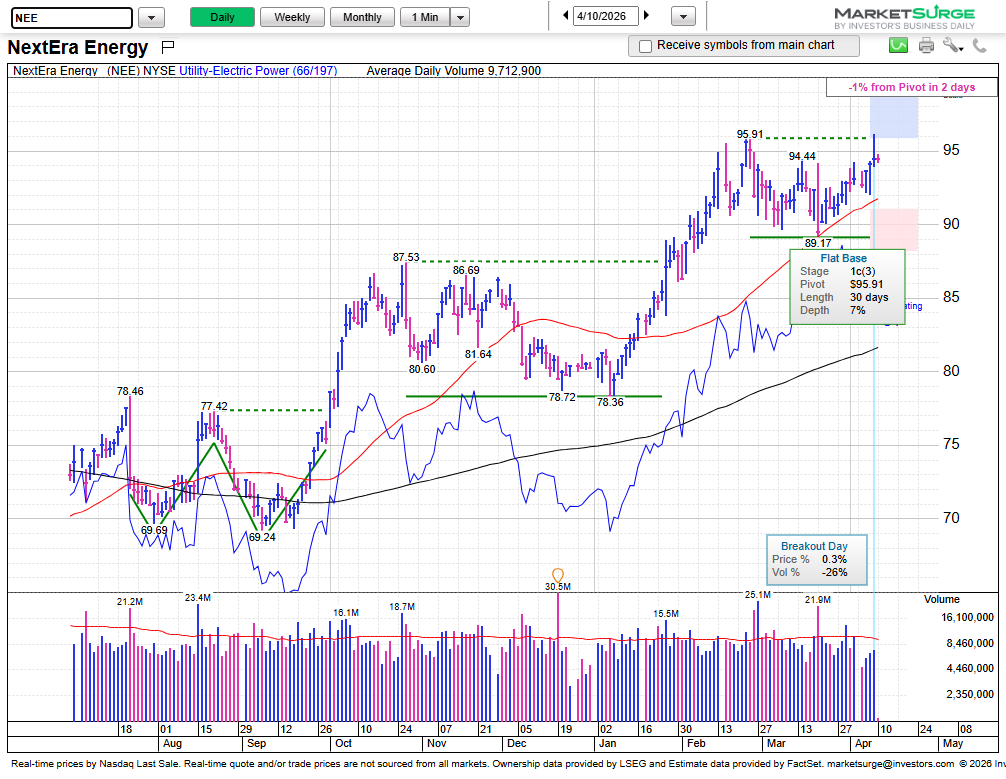
Examples – Many top winning stocks have launched massive price advances from each of these three chart patterns.