Cigna’s Removal From Russell Growth and Defensive Indices Might Change The Case For Investing In Cigna Group (CI)
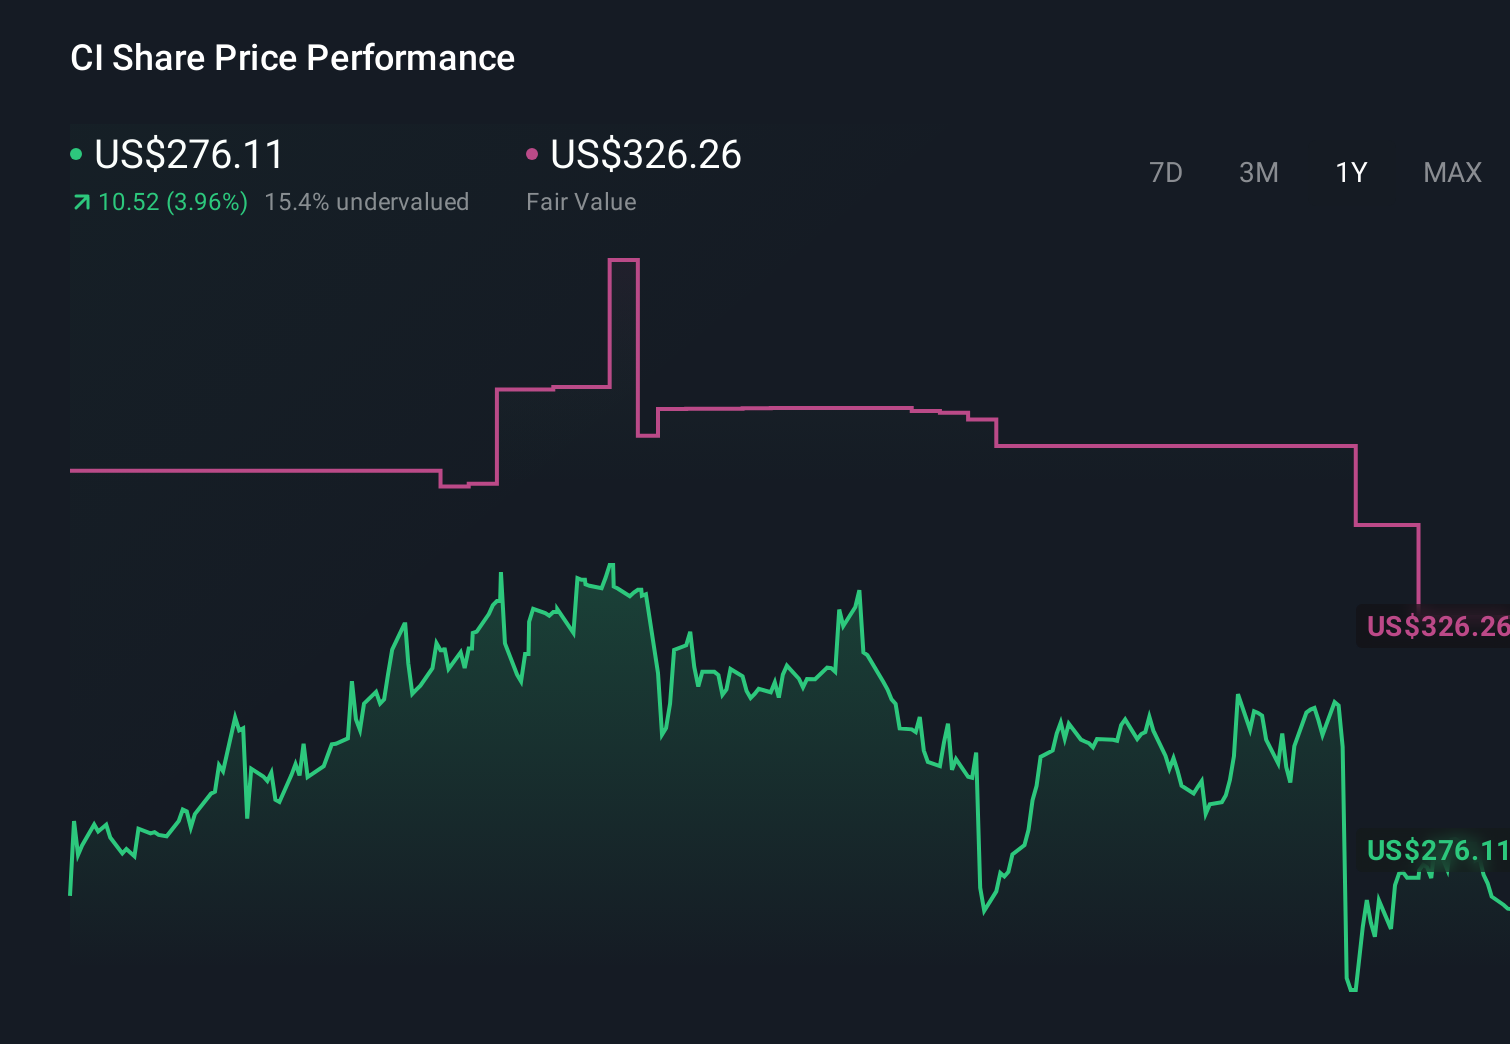
Cigna Group CI | 0.00 |
- The Cigna Group was recently removed from several major Russell indices, including multiple Russell 1000 and 3000 Growth and Defensive benchmarks, prompting portfolio rebalancing by index-tracking investors.
- This broad index removal reduces Cigna’s presence in key benchmark universes, which can influence how quantitatively driven funds and asset allocators view the stock.
- We’ll now examine how Cigna’s broad removal from Russell growth and defensive indices may affect its existing investment narrative and risk profile.
Rare earth metals are an input to most high-tech devices, military and defence systems and electric vehicles. The global race is on to secure supply of these critical minerals. Beat the pack to uncover the 30 best rare earth metal stocks of the very few that mine this essential strategic resource.
Cigna Group Investment Narrative Recap
To own Cigna Group today you need to believe in its ability to grow earnings from Evernorth health services and specialty pharmacy while managing regulatory scrutiny and affordability pressures. The broad removal from Russell growth and defensive indices mainly affects index-linked flows, and does not appear to change the primary near term catalyst around execution in Evernorth or the key risk tied to PBM regulation and margin pressure.
The most relevant recent development alongside the index changes is the planned CEO transition, with Brian Evanko set to succeed David Cordani on July 1, 2026. Leadership continuity and how the new CEO steers Evernorth and the broader portfolio will likely matter more for Cigna’s earnings trajectory than the mechanical selling linked to the Russell index removals.
Yet while index changes may be largely technical, investors should still pay close attention to the growing regulatory focus on PBM practices and how that could...
Cigna Group's narrative projects $315.1 billion revenue and $7.8 billion earnings by 2029. This requires 4.3% yearly revenue growth and about a $1.5 billion earnings increase from $6.3 billion today.
Uncover how Cigna Group's forecasts yield a $340.92 fair value, a 22% upside to its current price.
Exploring Other Perspectives
Nine members of the Simply Wall St Community currently estimate Cigna’s fair value between about US$310 and US$838 per share, reflecting wide variation in individual expectations. When you weigh those views against the concentration of Cigna’s earnings power in Evernorth’s PBM model and the regulatory risks around pricing and transparency, it becomes clear why exploring several perspectives on the company’s future is essential.
Explore 9 other fair value estimates on Cigna Group - why the stock might be worth over 3x more than the current price!
Reach Your Own Conclusion
Don't just follow the ticker - dig into the data and build a conviction that's truly your own.
- A great starting point for your Cigna Group research is our analysis highlighting 6 key rewards and 1 important warning sign that could impact your investment decision.
- Our free Cigna Group research report provides a comprehensive fundamental analysis summarized in a single visual - the Snowflake - making it easy to evaluate Cigna Group's overall financial health at a glance.
Curious About Other Options?
Early movers are already taking notice. See the stocks they're targeting before they've flown the coop:
- AI is about to change healthcare. These 41 stocks are working on everything from early diagnostics to drug discovery. The best part - they are all under $10b in market cap - there's still time to get in early.
- The future of work is here. Discover the 29 top robotics and automation stocks leading the charge in AI-driven automation and industrial transformation.
- Find 42 companies with promising cash flow potential yet trading below their fair value.
This article by Simply Wall St is general in nature. We provide commentary based on historical data and analyst forecasts only using an unbiased methodology and our articles are not intended to be financial advice. It does not constitute a recommendation to buy or sell any stock, and does not take account of your objectives, or your financial situation. We aim to bring you long-term focused analysis driven by fundamental data. Note that our analysis may not factor in the latest price-sensitive company announcements or qualitative material. Simply Wall St has no position in any stocks mentioned.