

CME Group (CME) Has Investors Asking A Bigger Question
CME Group Inc. Class A CME | 0.00 |
CME Group (CME) has drawn fresh attention after outlining three new futures initiatives in sports, compute and metals that expand its product set and around the clock trading access for different customer types.
For context, CME Group's 1-month share price return of 7.70% and 7-day share price return of 2.65% suggest momentum has picked up again after a 90-day period when the share price declined 2.68%. The 5-year total shareholder return of 70.23% points to a solid longer-term outcome.
If these new futures contracts have you thinking about where else growth and risk are being repriced, it could be worth scanning the market for other derivative linked opportunities using the 20 top founder-led companies
The recent move in CME Group raises a simple question. Are investors reassessing the core futures and clearing franchise in light of these new products, or is sentiment running ahead of what the current valuation supports?
Most Popular Narrative: 2.6% Undervalued
The most followed narrative for CME Group sets a fair value of $282.36 against the last close at $274.98. This implies a small valuation gap that depends on how earnings and margins evolve from here.
The ongoing global shift toward electronic trading, greater regulatory demands for transparency and standardized clearing, and a proven ability to grow non transactional revenue, for example record market data revenue, position CME to capture a larger share of trading activity and support durable long term earnings growth.
It is worth considering what assumptions have to align for that fair value to hold. The narrative points to measured revenue growth, slightly lower margins, and a re rated earnings multiple. The combination of these factors is what really drives the outcome.
Result: Fair Value of $282.36 (UNDERVALUED)
However, investors also need to weigh the risk that lower market volatility or faster adoption of DeFi style derivatives could put pressure on CME Group volumes and fees.
Another View on CME Group’s Valuation
The analyst fair value of $282.36 for CME Group points to a small upside gap versus the last close at $274.98. However, Simply Wall St's own DCF model suggests the stock is trading above an estimated future cash flow value of $247.18, which tilts the picture toward overvaluation. That leaves investors weighing which set of assumptions feels more realistic for CME Group.
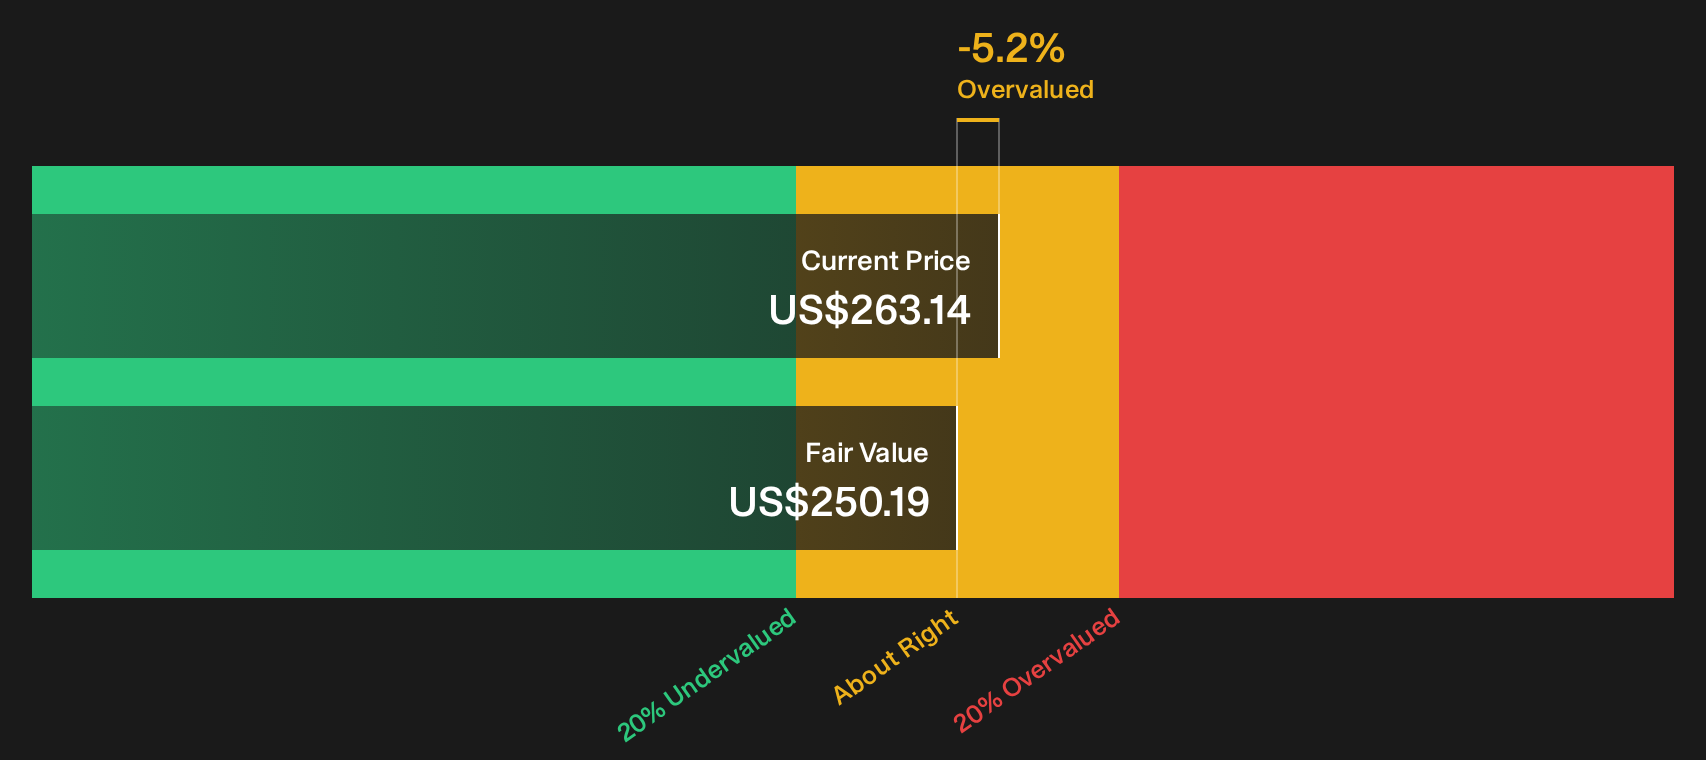
Simply Wall St performs a discounted cash flow (DCF) on every stock in the world every day (check out CME Group for example). We show the entire calculation in full. You can track the result in your watchlist or portfolio and be alerted when this changes, or use our stock screener to discover 48 high quality undervalued stocks. If you save a screener we even alert you when new companies match - so you never miss a potential opportunity.
Next Steps
If the split views on CME Group's valuation have you on the fence, this is a good time to review the underlying data and sentiment for yourself. To help frame both the potential upside and the concerns in one place, start with the 2 key rewards and 1 important warning sign.
Looking for more investment ideas beyond CME Group?
If CME Group's evolving story has you rethinking your portfolio, do not stop here. Use targeted stock lists to uncover opportunities that match your goals before others spot them.
- Target high potential under-the-radar opportunities by reviewing the screener containing 18 high quality undiscovered gems that pair quality fundamentals with less crowded ownership.
- Prioritise resilience in tougher markets by scanning the 75 resilient stocks with low risk scores focused on companies with steadier risk profiles.
- Build a core watchlist of financially robust businesses by checking the solid balance sheet and fundamentals stocks screener (50 results) that screens for stronger balance sheets and fundamentals.
This article by Simply Wall St is general in nature. We provide commentary based on historical data and analyst forecasts only using an unbiased methodology and our articles are not intended to be financial advice. It does not constitute a recommendation to buy or sell any stock, and does not take account of your objectives, or your financial situation. We aim to bring you long-term focused analysis driven by fundamental data. Note that our analysis may not factor in the latest price-sensitive company announcements or qualitative material. Simply Wall St has no position in any stocks mentioned.