Columbus McKinnon (CMCO) TTM Margin Slide To 0.4% Tests Bullish Profitability Narratives
Columbus McKinnon Corporation CMCO | 13.95 | -2.65% |
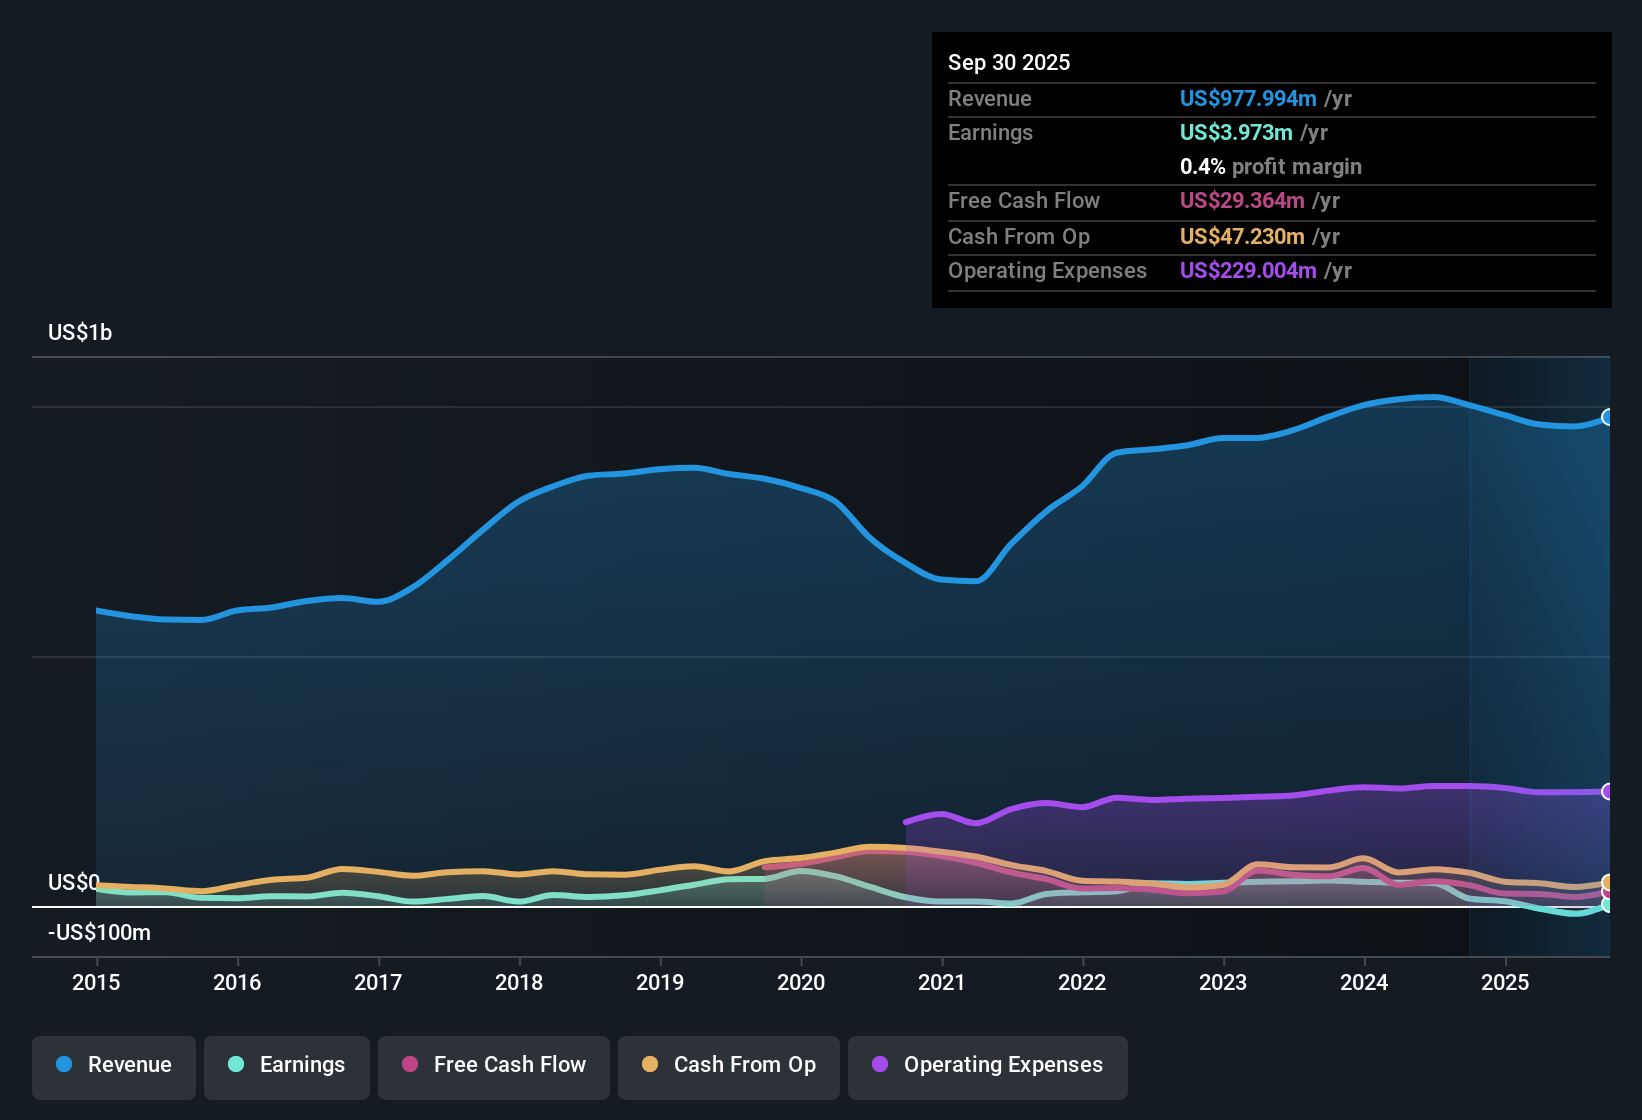
Columbus McKinnon (CMCO) has put fresh numbers on the table for Q3 2026, with recent quarterly revenue figures ranging from about US$234 million to US$261 million and basic EPS moving between a loss of US$0.52 and a gain of US$0.16 over the past six reported quarters. Over that same stretch, total revenue has oscillated within a relatively tight band of roughly US$234 million to US$262 million per quarter while EPS has swung from losses to modest profits, setting up a mixed picture that puts the focus firmly on how margins are holding up. With trailing net profit margin sitting at 0.4% against 1.5% a year earlier and a large one off loss weighing on the trailing figures, this set of results keeps investor attention on how efficiently the company is converting revenue into lasting profitability.
See our full analysis for Columbus McKinnon.With the headline numbers in place, the next step is to line them up against the prevailing narratives around Columbus McKinnon, to see which storylines the latest margin and earnings profile support and which ones they challenge.
TTM margin stuck at 0.4% despite nearly US$978m in sales
- Over the last twelve months, Columbus McKinnon generated about US$978 million in revenue and US$4.0 million in net income, which works out to a 0.4% net margin compared with 1.5% a year earlier.
- Bulls see this low margin as temporary, arguing that automation and Kito Crosby cost synergies could drive margins toward an adjusted EBITDA level of about 23%. However, recent quarters show EPS swinging between a loss of US$0.52 and a gain of US$0.30, which keeps the bullish view heavily dependent on future execution rather than what the current margin profile shows.
- The trailing earnings decline of 8.3% per year over five years and the one off US$37.4 million loss sit uncomfortably next to expectations for much higher profitability.
- Recent net income figures, such as US$4.6 million in Q2 2026 versus losses in several other quarters, highlight how variable profitability has been while the bullish narrative looks for much more stable earnings.
Bulls argue that these thin margins could be an inflection point rather than a ceiling, and they point to the full bullish thesis to explain why they think that gap can close. 🐂 Columbus McKinnon Bull Case
Multi year 8.3% earnings decline tests acquisition ambitions
- The data shows earnings falling at an average rate of 8.3% per year over the past five years, while recent quarterly net income has ranged from a loss of US$15.0 million to a profit of US$8.6 million on quarterly revenue between roughly US$234 million and US$261 million.
- Bears focus on this multi year decline and argue that higher leverage from the Kito Crosby deal, with pro forma net debt around 5x EBITDA, could make any further profit pressure more painful if costs or project timing do not line up with expectations.
- Weak interest coverage in the trailing data means existing earnings already offer limited room to comfortably handle interest payments, let alone additional debt service.
- Combined with softness in short cycle orders and project related lumpiness highlighted in the cautious narrative, the historical earnings slide gives bears concrete support for their concerns about profit stability.
Skeptics warn that tying a higher debt load to a business with shrinking earnings raises the bar for what the merger needs to deliver. 🐻 Columbus McKinnon Bear Case
Low 0.7x P/S and US$32.94 DCF fair value highlight valuation gap
- Shares trade on a P/S of 0.7x versus 2.3x for the US Machinery industry and 2.7x for peers, and a DCF fair value of US$32.94 sits above the current share price of US$23.27.
- Consensus narrative supporters point to this valuation gap as a potential upside signal. At the same time, the same dataset flags a 0.4% trailing margin and weak interest coverage, which means any move toward a price closer to the US$25.75 analyst target would likely depend on the company turning that discounted multiple into stronger, more consistent profitability.
- The one off US$37.4 million loss is a clear distortion in the recent period, yet even after adjusting for that event, the trailing margin remains well below the prior year level of 1.5%.
- Until the earnings line reflects the revenue base more fully, the low P/S and DCF fair value gap mainly indicate that the market is already baking in these profitability and balance sheet concerns.
Next Steps
To see how these results tie into long-term growth, risks, and valuation, check out the full range of community narratives for Columbus McKinnon on Simply Wall St. Add the company to your watchlist or portfolio so you'll be alerted when the story evolves.
See the numbers differently? If this data points you in another direction, put that view into your own narrative in just a few minutes, Do it your way.
A great starting point for your Columbus McKinnon research is our analysis highlighting 1 key reward and 4 important warning signs that could impact your investment decision.
Explore Alternatives
Columbus McKinnon is operating with thin 0.4% trailing margins, earnings that have declined over several years, and weak interest coverage on higher debt.
If that mix of fragile profitability and balance sheet pressure makes you uneasy, consider companies in our 84 resilient stocks with low risk scores that aim for steadier financial profiles.
This article by Simply Wall St is general in nature. We provide commentary based on historical data and analyst forecasts only using an unbiased methodology and our articles are not intended to be financial advice. It does not constitute a recommendation to buy or sell any stock, and does not take account of your objectives, or your financial situation. We aim to bring you long-term focused analysis driven by fundamental data. Note that our analysis may not factor in the latest price-sensitive company announcements or qualitative material. Simply Wall St has no position in any stocks mentioned.