Commercial Metals (CMC) Stock After 49% Annual Gain Is There Still Room To Run
Commercial Metals Company CMC | 0.00 |
- If you are wondering whether Commercial Metals stock still offers value after a strong run, this article walks through what the current price may be implying.
- The shares recently closed at US$72.36, with the price down 6.9% over the past week but up 4.4% over 30 days and 49.4% over the past year, which can change how investors think about both upside and risk.
- These moves sit against a backdrop of ongoing interest in metals and construction related companies. Investors often watch for updates on project pipelines, capacity expansions, or major contract announcements, as such news can quickly shift expectations for Commercial Metals and help explain sharp short term price swings.
- On Simply Wall St’s valuation checks, Commercial Metals currently has a valuation score of 5 out of 6. This score will be unpacked using different methods, and the article will finish by highlighting a broader way to think about what that score really means for you.
Approach 1: Commercial Metals Discounted Cash Flow (DCF) Analysis
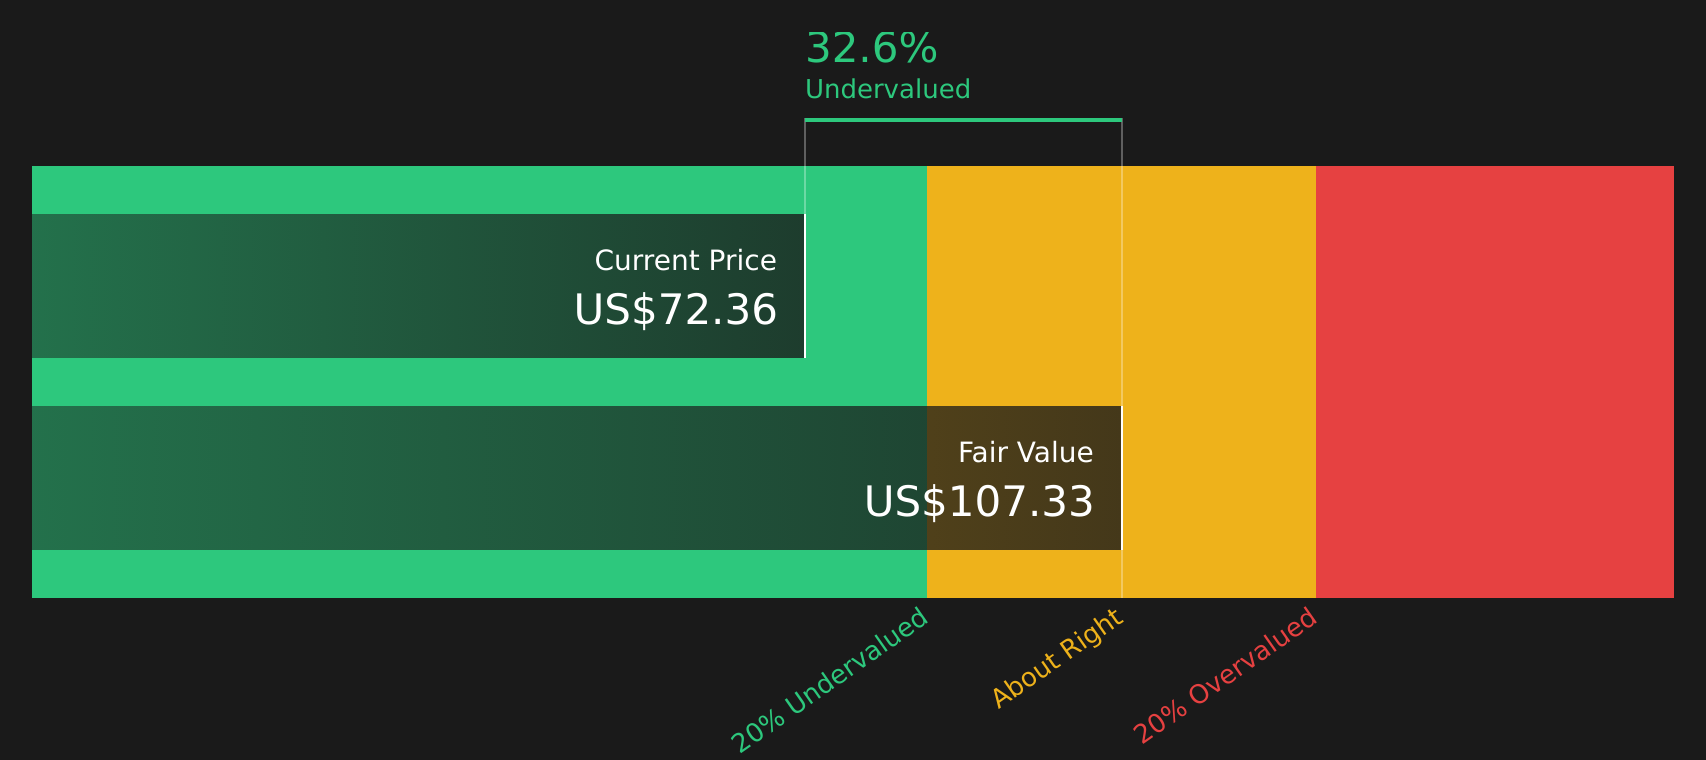
A Discounted Cash Flow, or DCF, model estimates what Commercial Metals stock could be worth by projecting future cash flows and then discounting them back to today using a required rate of return. The focus is on cash the company could generate for shareholders rather than short term earnings moves.
Commercial Metals most recent Free Cash Flow is about $397.9 million. Simply Wall St uses a 2 Stage Free Cash Flow to Equity model, which combines analyst forecasts with its own extrapolations. For example, projected Free Cash Flow for 2028 is $797.7 million, and the model extends estimates out to 2035, with each future cash flow discounted back to a present value using the DCF approach.
Putting all of those discounted projections together, the model arrives at an estimated intrinsic value of about $107.24 per share. Compared with the recent share price of $72.36, this DCF output suggests Commercial Metals stock is trading at a 32.5% discount to that estimate. On this model alone, that output indicates a meaningfully undervalued reading.
Result: UNDERVALUED
Our Discounted Cash Flow (DCF) analysis suggests Commercial Metals is undervalued by 32.5%. Track this in your watchlist or portfolio, or discover 45 more high quality undervalued stocks.
Approach 2: Commercial Metals Price vs Earnings
For a profitable company like Commercial Metals, the P/E ratio is a straightforward way to link what you pay for the stock to the earnings it currently generates. It shows how many dollars investors are paying today for each dollar of earnings.
What counts as a “normal” P/E depends on what investors expect from a company and how risky they think those earnings are. Higher expected growth or lower perceived risk can justify a higher multiple, while slower growth or higher risk usually lines up with a lower P/E.
Commercial Metals currently trades on a P/E of 15.88x. That sits below both the Metals and Mining industry average of 17.77x and the peer group average of 29.31x. Simply Wall St’s Fair Ratio for Commercial Metals is 19.37x, which is its proprietary view of what the P/E could be given factors such as the company’s earnings profile, industry, profit margins, market cap and identified risks.
Compared with simple industry or peer averages, the Fair Ratio aims to be more tailored because it adjusts for these company specific characteristics rather than assuming all peers deserve similar valuations. With the current P/E at 15.88x versus a Fair Ratio of 19.37x, this approach points to the stock looking undervalued on earnings.
Result: UNDERVALUED

P/E ratios tell one story, but what if the real opportunity lies elsewhere? Start investing in legacies, not executives. Discover our 20 top founder-led companies.
Upgrade Your Decision Making: Choose your Commercial Metals Narrative
Earlier it was mentioned that there is an even better way to understand valuation. Narratives take the Commercial Metals story you believe in, link it to a set of revenue, earnings and margin forecasts, and convert that into a Fair Value you can easily compare with today’s price.
Think of a Narrative as your clear, written view of what happens next for Commercial Metals, whether that looks closer to the bullish Fair Value around US$85.00, the more cautious view near US$68.00, or something in between like the consensus Fair Value of about US$80.55. Each view is tied to specific assumptions on growth, margins, P/E and discount rate.
On Simply Wall St’s Community page, Narratives are available as an easy tool that many investors use to connect their reasoning with the numbers, see how their own Commercial Metals Fair Value compares with the live share price, and have that view automatically refreshed when new earnings, news or forecast changes are incorporated into the underlying models.
For Commercial Metals, however, we will make it really easy for you with previews of two leading Commercial Metals narratives:
Fair value in this bullish narrative: US$80.55
Implied discount to this fair value at the recent US$72.36 share price: about 10.2% undervalued
Revenue growth assumption in this view: 7.80% a year
- Analysts in this narrative expect Commercial Metals to benefit from programs like TAG and new mills in Arizona and West Virginia, with these projects feeding into higher production volumes and improved margins over time.
- The view assumes continued revenue growth, a small uplift in profit margins and ongoing buybacks, with earnings projected to reach US$714.6m by around June 2029 on a P/E of 16.0x.
- Key risks flagged include potential construction slowdowns, rebar competition, operational challenges on new capacity, and geopolitical or policy setbacks in Europe that could weigh on earnings.
Fair value in this cautious narrative: US$68.00
Implied premium to this fair value at the recent US$72.36 share price: about 6.4% overvalued
Revenue growth assumption in this view: 5.89% a year
- This narrative leans on concerns that shifts toward low carbon materials, automation and global steel overcapacity could make it harder for Commercial Metals to sustain margins and volume growth.
- The bearish cohort assumes slower revenue growth, a modest squeeze on profit margins and earnings of US$561.3m by around June 2029, paired with a higher 17.2x P/E multiple to justify a US$68.00 fair value.
- It also highlights risks around construction cyclicality, scrap price volatility and higher capital needs for mill upgrades, even though it acknowledges that efficiency programs and balance sheet strength could cushion some of that pressure.
These two Commercial Metals narratives sit on either side of the recent price and provide clear, quantified assumptions on growth, margins and valuation multiples so you can decide which story, if either, lines up more closely with your own view of the stock.
For a fuller picture of how other investors are framing Commercial Metals across both upside and downside scenarios, including detailed narrative assumptions and valuation paths, See what the community is saying about Commercial Metals.
Do you think there's more to the story for Commercial Metals? Head over to our Community to see what others are saying!

This article by Simply Wall St is general in nature. We provide commentary based on historical data and analyst forecasts only using an unbiased methodology and our articles are not intended to be financial advice. It does not constitute a recommendation to buy or sell any stock, and does not take account of your objectives, or your financial situation. We aim to bring you long-term focused analysis driven by fundamental data. Note that our analysis may not factor in the latest price-sensitive company announcements or qualitative material. Simply Wall St has no position in any stocks mentioned.