CoreWeave (CRWV): Assessing Valuation After Share Price Climbs 7% and 231% Year-to-Date
CoreWeave, Inc. Class A CRWV | 77.47 | +12.03% |
CoreWeave (CRWV) shares have edged higher recently, drawing fresh attention from market watchers. With the stock up 7% in the past day and a year-to-date return above 230%, investors are keenly tracking what comes next.
CoreWeave’s 231% year-to-date share price return has marked it as one of this year’s standout movers, with momentum building again after this week’s uptick. After a brief pause in recent weeks, fresh buying suggests renewed optimism around the company’s outlook and growth story.
If you’re keen to spot the next fast-rising play, now is the perfect time to broaden your perspective and discover fast growing stocks with high insider ownership
With such a dramatic run-up, the key question for investors is whether CoreWeave is trading below its true value or if enthusiastic buyers have already factored in all the company’s future potential, leaving little room for upside.
Price-to-Sales Ratio of 19.5x: Is it justified?
CoreWeave currently trades at a price-to-sales ratio of 19.5x. This places it below the peer average but well above the broader US IT industry. At yesterday’s close of $132.55, the market continues to assign CoreWeave a premium for its growth trajectory.
The price-to-sales ratio compares a company’s market capitalization to its annual revenue. This makes it particularly relevant for high-growth tech firms that may not yet be profitable. For CoreWeave, this suggests investors are willing to pay a significant premium for each dollar of revenue, likely based on robust future expectations.
Compared to similar companies, CoreWeave’s price-to-sales ratio is lower than its peer average of 22x. This indicates it may be relatively attractive within its immediate group. However, the ratio is notably higher than the US IT industry average of 2.8x, underscoring how much optimism is priced into CoreWeave’s shares. The current figure also sits well below the estimated fair price-to-sales ratio of 45.7x, highlighting a level the market could potentially move toward if expectations are met.
Result: Price-to-Sales Ratio of 19.5x (UNDERVALUED)
However, softer revenue growth or persistent net losses could shift sentiment. This may remind investors that high expectations always come with heightened risk.
Another View: What Does the SWS DCF Model Suggest?
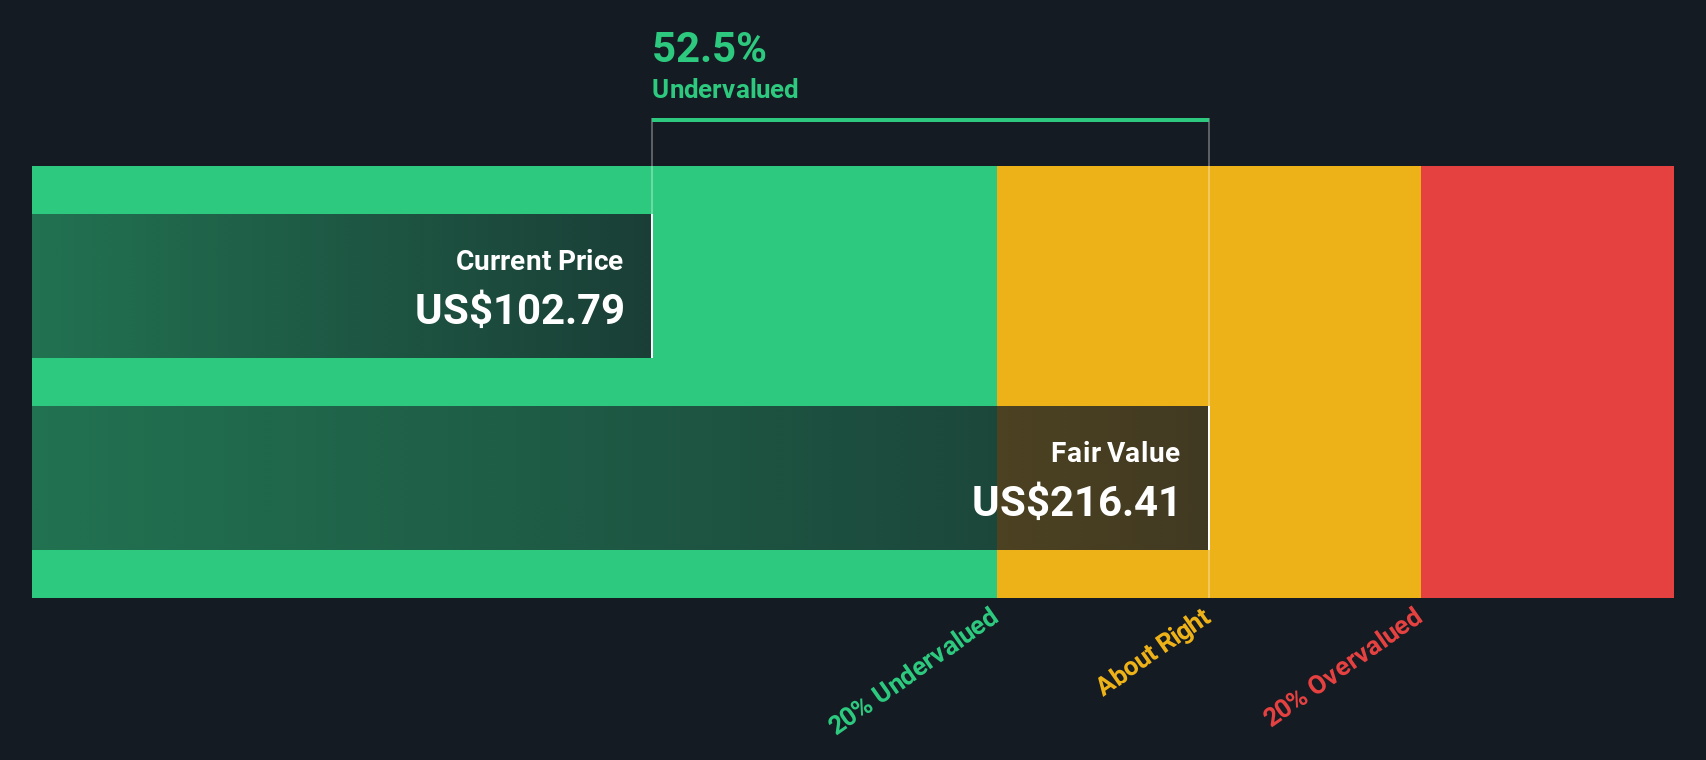
Switching gears to our DCF model, the numbers tell an even more optimistic story. At $132.55, CoreWeave trades roughly 69% below our estimated fair value of $428.99, which may indicate strong undervaluation. Could the market be underestimating CoreWeave’s potential, or is the projection too bullish?
Simply Wall St performs a discounted cash flow (DCF) on every stock in the world every day (check out CoreWeave for example). We show the entire calculation in full. You can track the result in your watchlist or portfolio and be alerted when this changes, or use our stock screener to discover undervalued stocks based on their cash flows. If you save a screener we even alert you when new companies match - so you never miss a potential opportunity.
Build Your Own CoreWeave Narrative
If you have your own perspective or want to interpret the numbers for yourself, you can build a personalized take on CoreWeave’s story in just minutes. Do it your way
A great starting point for your CoreWeave research is our analysis highlighting 3 key rewards and 3 important warning signs that could impact your investment decision.
Looking for more investment ideas?
Let smart analysis work for you. Expand your watchlist with new opportunities you might otherwise miss. The right idea today could be tomorrow’s breakout.
- Boost your income potential and spot companies committed to steady returns by checking out these 17 dividend stocks with yields > 3%.
- Ride the AI revolution by unlocking access to these 27 AI penny stocks shaping tomorrow’s most innovative sectors.
- Seize untapped value with these 877 undervalued stocks based on cash flows and put overlooked growth stories on your radar before they hit the mainstream.
This article by Simply Wall St is general in nature. We provide commentary based on historical data and analyst forecasts only using an unbiased methodology and our articles are not intended to be financial advice. It does not constitute a recommendation to buy or sell any stock, and does not take account of your objectives, or your financial situation. We aim to bring you long-term focused analysis driven by fundamental data. Note that our analysis may not factor in the latest price-sensitive company announcements or qualitative material. Simply Wall St has no position in any stocks mentioned.