Corteva (CTVA) Margin Improvement Reinforces Bullish Earnings Narrative Despite Slower Revenue Growth
Corteva Inc CTVA | 85.46 | +1.97% |
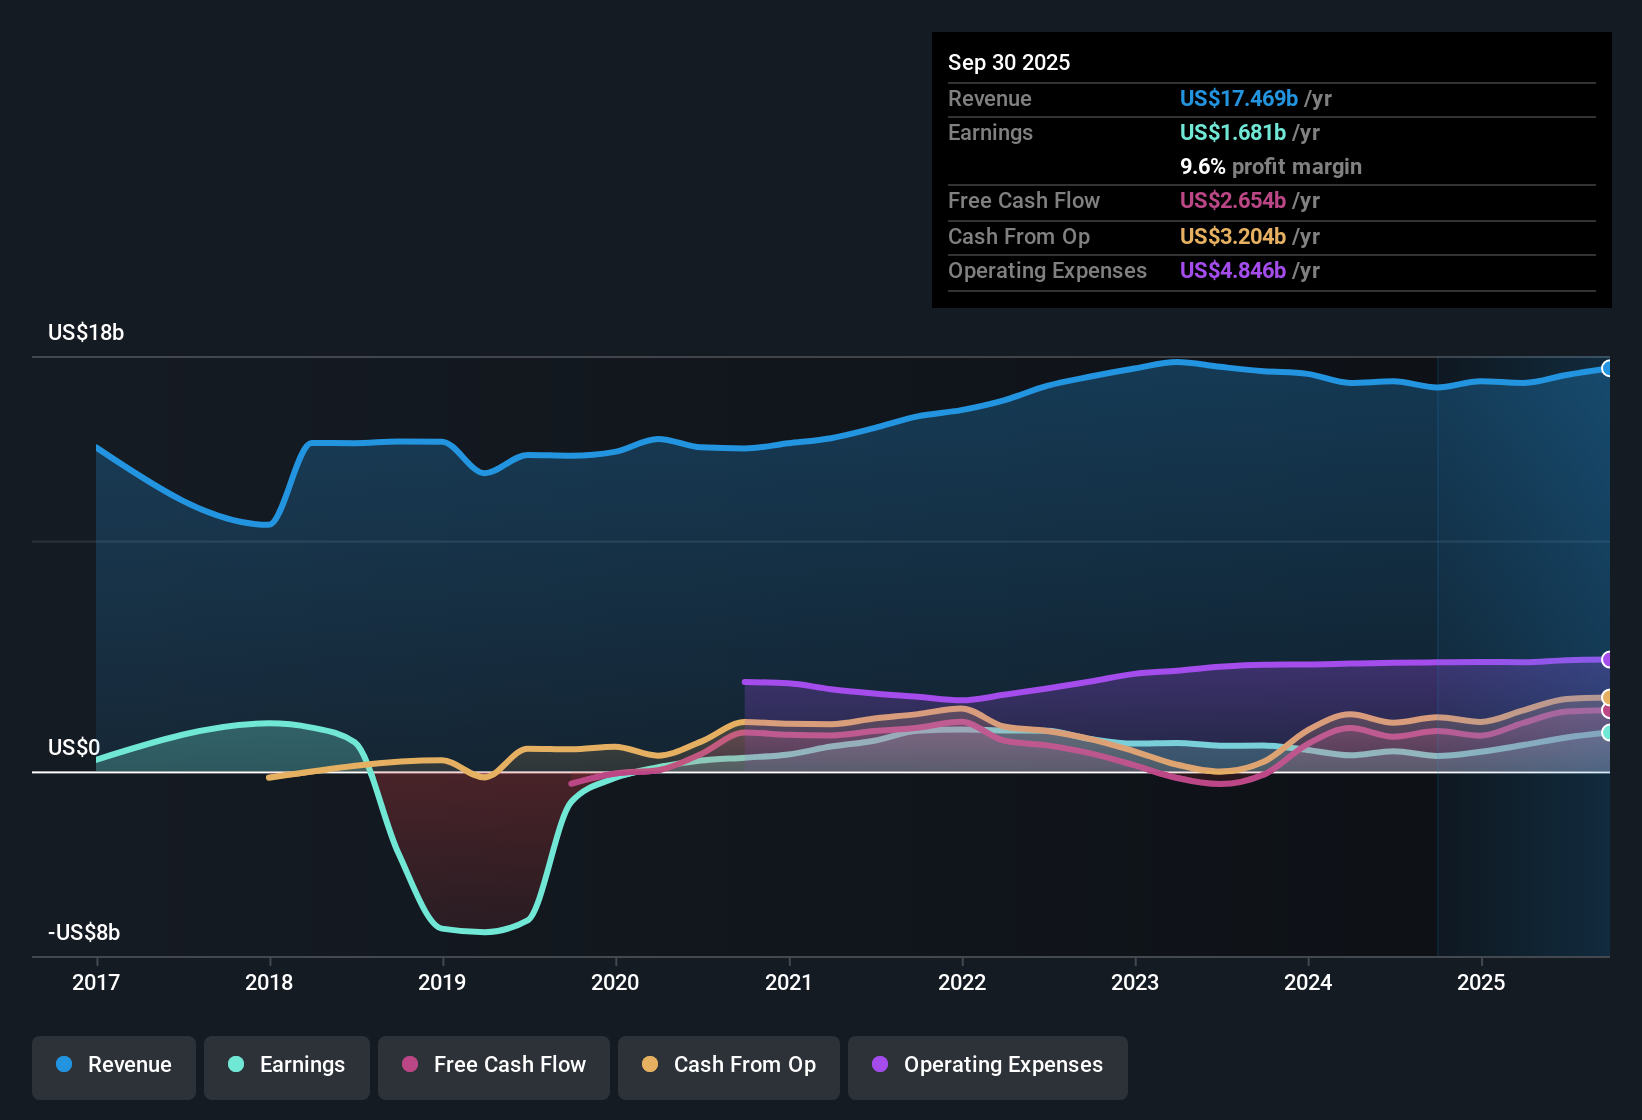
Corteva (CTVA) has wrapped up FY 2025 with Q4 revenue of US$3.9b and a basic EPS loss of US$0.80, while the trailing twelve month line shows revenue of US$17.4b and basic EPS of US$1.75, alongside earnings growth of 40.2% over the last year. Over recent periods, revenue has sat in a US$2.6b to US$6.5b quarterly range with EPS swinging between quarterly profits and losses, while on a trailing basis earnings are forecast to grow about 20.7% per year. With a trailing net margin of 6.9% versus 5% last year, investors are likely to focus on how much of this earnings profile is coming from cleaner, more sustainable profitability.
See our full analysis for Corteva.With the headline numbers on the table, the next step is to see how this earnings profile lines up with the widely held narratives around Corteva's growth, quality of profits, and margin trajectory, and where those stories might need a rethink.
US$1.2b profit over the last year despite lumpy quarters
- On a trailing 12 month basis, Corteva earned US$1.2b of net income on US$17.4b of revenue, even though individual quarters swung from a US$1.4b profit in Q2 2025 to a US$540m loss in Q4 2025.
- What stands out for a bullish view is that full year earnings growth of 40.2% sits alongside these ups and downs. This raises two useful questions for you as an investor:
- Consensus narrative notes that earnings are forecast to grow about 20.7% per year, and the trailing US$1.2b profit provides the base that this forecast is built on.
- At the same time, quarterly numbers ranging from a US$663m profit in Q1 2025 to a US$310m loss in Q3 2025 show that even with strong year over year growth, the path from one quarter to the next is not smooth.
Margins at 6.9% with slower 3.2% revenue growth
- Corteva earned a 6.9% net margin over the last 12 months, compared with 5% the prior year, while revenue is forecast to grow about 3.2% per year versus a 10.1% forecast for the broader US market.
- For a bullish angle, supporters often point to margin strength as the key pillar, and the numbers give them some help but also a clear trade off to think about:
- The move from a 5% to 6.9% trailing margin, on roughly US$17.4b of revenue, leans in favor of a quality of earnings story where profit per dollar of sales is higher than before.
- Critics highlight that the same dataset shows revenue growth expected at only 3.2% per year, which is well below the US market’s 10.1% forecast, so any bullish view has to rest more on profitability than on fast top line expansion.
Premium 42.3x P/E and price above DCF fair value
- The shares trade on a 42.3x P/E versus 15.1x for peers and 24.3x for the US Chemicals industry, and the current share price of US$75.12 sits above a DCF fair value estimate of US$64.79.
- Bears argue that this combination reflects a stretched setup, and the figures you have here give that cautious view some specific hooks:
- The gap between a 42.3x P/E and a 15.1x peer average means investors are paying close to 3x the peer multiple for Corteva’s trailing US$1.75 EPS, even though forecast revenue growth of 3.2% per year is slower than the wider US market.
- The fact that the share price of US$75.12 is above the DCF fair value estimate of US$64.79 adds another layer for those cautious on valuation, since it points to a premium not just versus peers but also versus a cash flow based estimate of worth.
Next Steps
Don't just look at this quarter; the real story is in the long-term trend. We've done an in-depth analysis on Corteva's growth and its valuation to see if today's price is a bargain. Add the company to your watchlist or portfolio now so you don't miss the next big move.
See What Else Is Out There
Corteva pairs lumpy quarterly earnings with slower forecast revenue growth of 3.2% per year, yet trades on a premium 42.3x P/E above a DCF fair value estimate of US$64.79.
If paying up for that kind of profile makes you uneasy, shift your focus to these 872 undervalued stocks based on cash flows today and zero in on companies where pricing looks more aligned with fundamentals.
This article by Simply Wall St is general in nature. We provide commentary based on historical data and analyst forecasts only using an unbiased methodology and our articles are not intended to be financial advice. It does not constitute a recommendation to buy or sell any stock, and does not take account of your objectives, or your financial situation. We aim to bring you long-term focused analysis driven by fundamental data. Note that our analysis may not factor in the latest price-sensitive company announcements or qualitative material. Simply Wall St has no position in any stocks mentioned.