

Denali Therapeutics (DNLI) Looks Fully Valued Following Its 32% 30 Day Rally
Denali Therapeutics Inc. DNLI | 0.00 |
Denali Therapeutics (DNLI) has drawn investor attention after a strong share price move over the past month and past 3 months, prompting fresh questions about how its pipeline and financial profile line up.
Beyond the recent surge, Denali Therapeutics shows a 30 day share price return of 32.33% and a 1 year total shareholder return of 75.83%. However, 3 and 5 year total shareholder returns remain in decline, suggesting momentum has turned only relatively recently.
If you are looking for more ideas in a similar space, this is a good moment to scan other healthcare focused AI opportunities using the 40 healthcare AI stocks
With Denali Therapeutics now up sharply over the past year and trading at a discount to the average analyst price target, the key question is whether the current valuation still leaves room for upside or if the market is already pricing in future growth.
Preferred Price to Book Multiple of 4.4x: Is it justified?
On the latest figures, Denali Therapeutics trades on a P/B of 4.4x compared to 2.8x for the broader US biotech industry. The stock therefore sits at a premium even after the recent move, while still below the 9.8x average of its closer peer group.
The P/B multiple compares the market value of the company to its net assets. This is a common way to look at early stage biopharma businesses that are still loss making and generating little or no revenue. For Denali Therapeutics, this highlights how investors are focusing on the value of its pipeline and platform rather than current earnings, given the company reported a net loss of $508.02m and less than $1m in revenue.
Against the wider US biotechs industry, a 4.4x P/B suggests the market is placing a richer value on Denali Therapeutics relative to balance sheet equity. However, compared with the 9.8x peer average it sits at a discount, which may reflect a more cautious stance on its stage of development, funding mix and the time it could take to address its ongoing losses.
Result: Price-to-book of 4.4x (ABOUT RIGHT)
However, there are clear pressure points for Denali Therapeutics, including its current net loss of $508.02m and the risk that key pipeline programs could face clinical or regulatory setbacks.
Another View on Denali Therapeutics Using Our DCF Model
The SWS DCF model paints a different picture for Denali Therapeutics. At a share price of $25.83, the stock is trading above an estimated future cash flow value of $21.13, which points to a degree of overvaluation on this measure. So which signal should carry more weight for you right now?
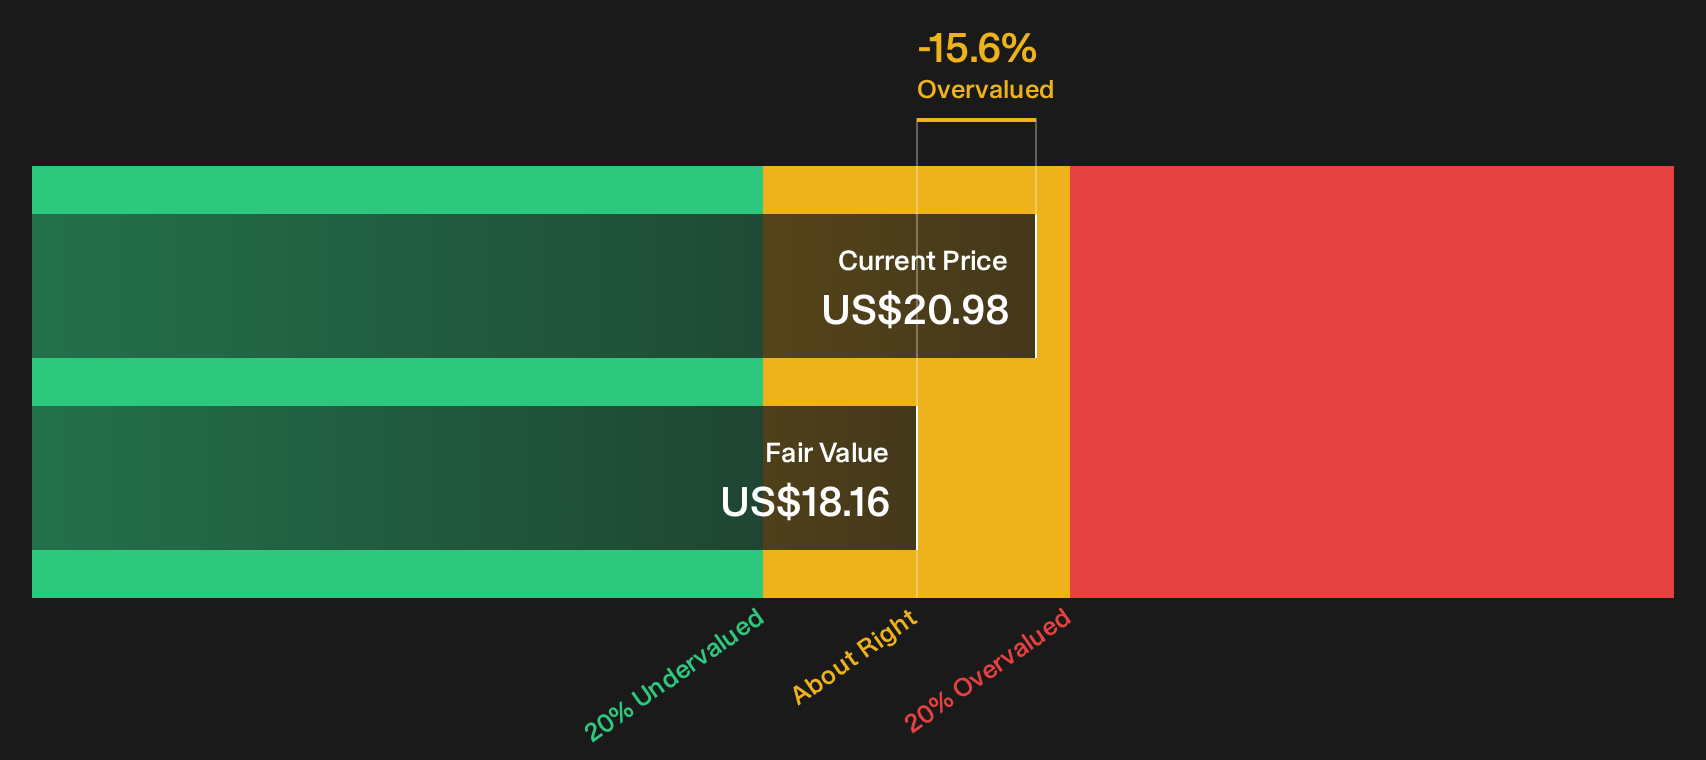
Simply Wall St performs a discounted cash flow (DCF) on every stock in the world every day (check out Denali Therapeutics for example). We show the entire calculation in full. You can track the result in your watchlist or portfolio and be alerted when this changes, or use our stock screener to discover 44 high quality undervalued stocks. If you save a screener we even alert you when new companies match - so you never miss a potential opportunity.
Next Steps
With sentiment on Denali Therapeutics looking finely balanced between opportunity and risk, this is a good time to review the details yourself and move promptly, starting with the 1 key reward and 2 important warning signs.
Looking for more investment ideas beyond Denali Therapeutics?
If Denali Therapeutics has sharpened your focus, do not stop here. Use the Simply Wall St screener to spot other opportunities that fit your style.
- Target potential bargains with strong quality markers by scanning 44 high quality undervalued stocks that may align better with your risk and return preferences.
- Prioritise resilience by reviewing 74 resilient stocks with low risk scores so you are not the one finding out too late which stocks carry hidden fragility.
- Get ahead of the crowd by checking the screener containing 18 high quality undiscovered gems before these companies attract wider attention and tighter pricing.
This article by Simply Wall St is general in nature. We provide commentary based on historical data and analyst forecasts only using an unbiased methodology and our articles are not intended to be financial advice. It does not constitute a recommendation to buy or sell any stock, and does not take account of your objectives, or your financial situation. We aim to bring you long-term focused analysis driven by fundamental data. Note that our analysis may not factor in the latest price-sensitive company announcements or qualitative material. Simply Wall St has no position in any stocks mentioned.