

Did Sylvamo’s (SLVM) Quarterly Loss Subtly Reshape Its Long-Term Earnings Story?
Sylvamo Corporation SLVM | 0.00 |
- Sylvamo Corporation reported its second-quarter 2026 results, with sales of US$806 million and a net loss of US$11 million, reversing net income a year earlier.
- The shift from earnings per share of US$0.37 to a loss of US$0.28 from continuing operations highlights mounting pressure on profitability despite slightly higher sales.
- We’ll now examine how this swing to a quarterly net loss may affect Sylvamo’s investment narrative and longer-term earnings outlook.
Invest in the nuclear renaissance through our list of 89 elite nuclear energy infrastructure plays powering the global AI revolution.
Sylvamo Investment Narrative Recap
To own Sylvamo, you need to believe its core uncoated freesheet and pulp business can stay cash generative despite structural headwinds and recent earnings volatility. The swing to a Q2 net loss of US$11 million and a first half loss of US$14 million raises questions about how quickly margins can recover, but it does not yet clearly overturn the key near term catalyst: better profitability as outage costs ease and operational projects ramp. The main risk remains sustained weak demand and pricing in Europe.
The most relevant recent announcement here is Sylvamo’s continued quarterly dividend of US$0.45 per share, maintained through mid 2026 despite losses. This signals management’s confidence in underlying cash generation, but it also intersects with a key risk: significant capital needs for mill upgrades and maintenance can pressure free cash flow, especially when earnings are under strain. For investors, the balance between funding investments and supporting shareholder returns is becoming more important after this quarter.
Yet beneath the headline dividend, there is a growing risk to free cash flow that investors should be aware of if capital spending stays elevated and...
Sylvamo's narrative projects $3.4 billion revenue and $306.8 million earnings by 2029. This requires 1.4% yearly revenue growth and a $204.8 million earnings increase from $102.0 million today.
Uncover how Sylvamo's forecasts yield a $51.75 fair value, a 26% upside to its current price.
Exploring Other Perspectives
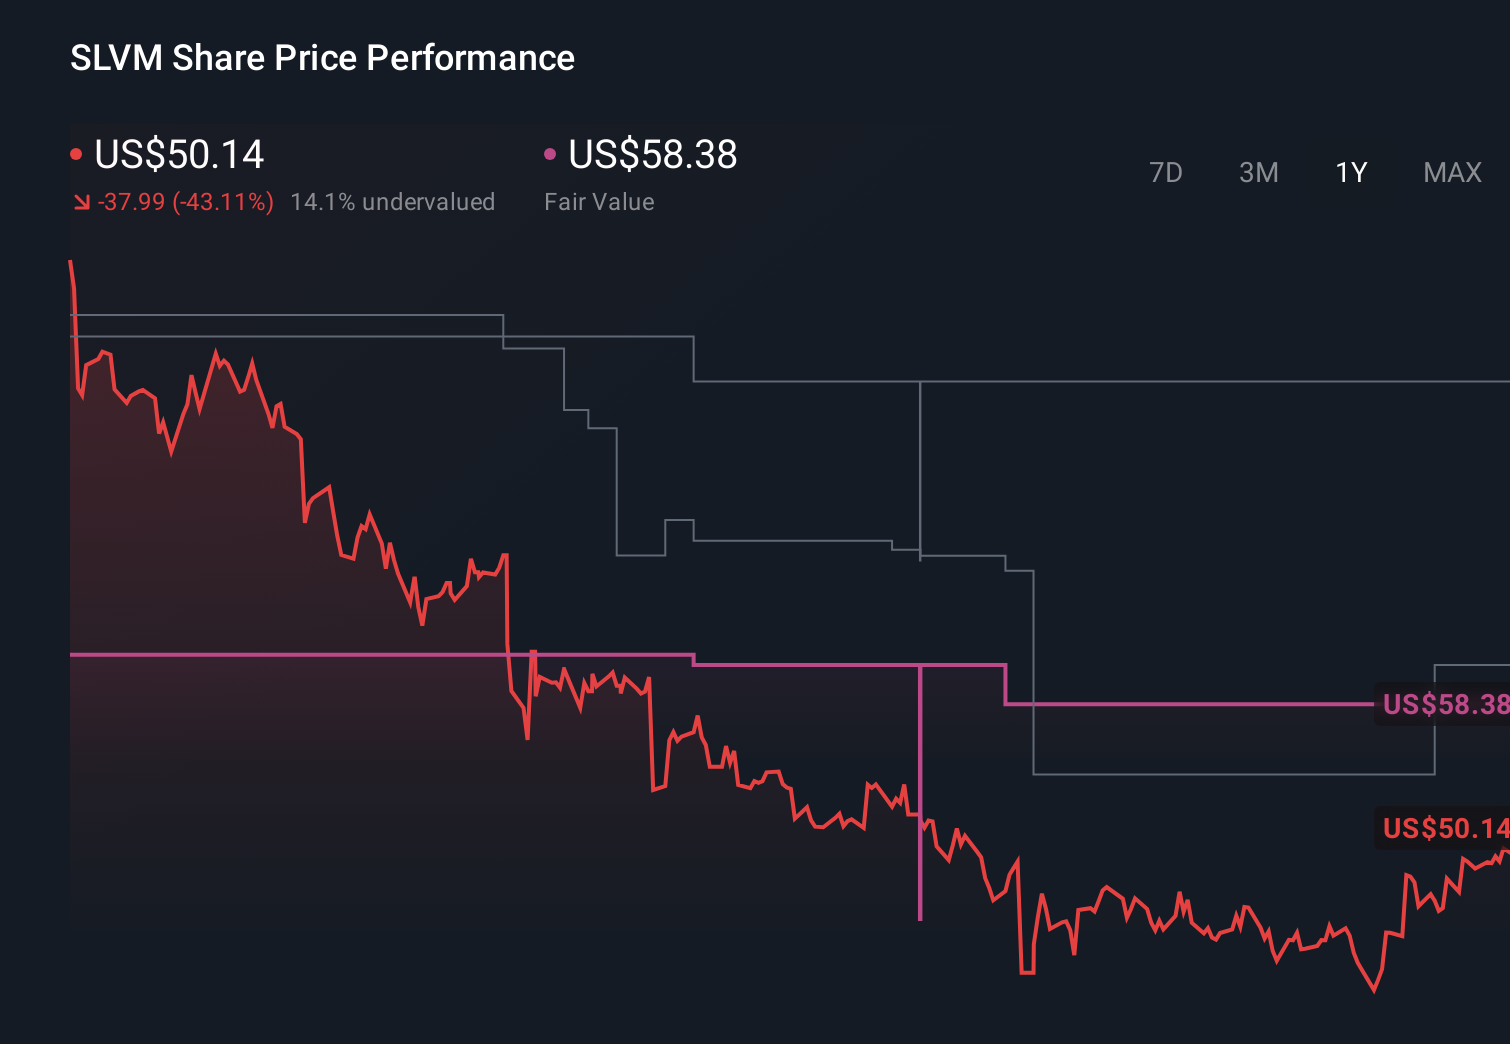
Some of the most optimistic analysts were assuming Sylvamo could lift earnings to about US$302.0 million by 2029 and grow revenue to roughly US$3.4 billion, which is a very different story from a half year net loss and rising concerns about regulatory costs and shrinking paper demand. This latest quarter may prompt you to reassess which version of Sylvamo’s future you find more convincing and to weigh several competing views before deciding what makes sense for you.
Explore 3 other fair value estimates on Sylvamo - why the stock might be worth over 2x more than the current price!
The Verdict Is Yours
Don't just follow the ticker - dig into the data and build a conviction that's truly your own.
- A great starting point for your Sylvamo research is our analysis highlighting 3 key rewards and 3 important warning signs that could impact your investment decision.
- Our free Sylvamo research report provides a comprehensive fundamental analysis summarized in a single visual - the Snowflake - making it easy to evaluate Sylvamo's overall financial health at a glance.
Searching For A Fresh Perspective?
The market won't wait. These fast-moving stocks are hot now. Grab the list before they run:
- Explore 26 top quantum computing companies leading the revolution in next-gen technology and shaping the future with breakthroughs in quantum algorithms, superconducting qubits, and cutting-edge research.
- Find 51 companies with promising cash flow potential yet trading below their fair value.
- AI is about to change healthcare. These 43 stocks are working on everything from early diagnostics to drug discovery. The best part - they are all under $10b in market cap - there's still time to get in early.
This article by Simply Wall St is general in nature. We provide commentary based on historical data and analyst forecasts only using an unbiased methodology and our articles are not intended to be financial advice. It does not constitute a recommendation to buy or sell any stock, and does not take account of your objectives, or your financial situation. We aim to bring you long-term focused analysis driven by fundamental data. Note that our analysis may not factor in the latest price-sensitive company announcements or qualitative material. Simply Wall St has no position in any stocks mentioned.