Do FMC Shares Offer Value After 74% Drop and Analyst Downgrades?
FMC Corporation FMC | 17.15 | -0.41% |
- Wondering if FMC stock could be a bargain or a value trap? You are not alone as this company has caught the eye of many investors asking the same question.
- FMC shares have plummeted, dropping 50.2% in the past week and a staggering 74.6% over the last year. These declines signal big shifts in market sentiment and possibly the underlying business.
- Recently, FMC’s sharp decline has been linked to a series of analyst downgrades and strategic concerns about weak demand in key markets, which stoked concerns among investors. Industry news has also spotlighted increasing competition and evolving regulatory pressures impacting the company’s long-term outlook.
- All this drama leaves FMC with a valuation score of 5 out of 6 on our quick checks, suggesting the stock might be seriously undervalued. Next, we will dig into what these valuation checks mean and compare them with some classic approaches. Stick around, as the most insightful lens for understanding FMC’s value is still to come.
Approach 1: FMC Discounted Cash Flow (DCF) Analysis
The Discounted Cash Flow (DCF) method values a company by forecasting its expected future cash flows and discounting them back to today's value using a required rate of return. This technique gives investors a sense of what the business might really be worth based on its ability to generate cash in the future, rather than just market emotions.
For FMC, the most recent Free Cash Flow (FCF) stands at -$400.7 million, reflecting recent business headwinds. Analyst estimates and model projections anticipate this figure rebounding to about $360 million by 2029. While estimates are only available for the next five years, Simply Wall St continues with cautious extrapolations out to 2035.
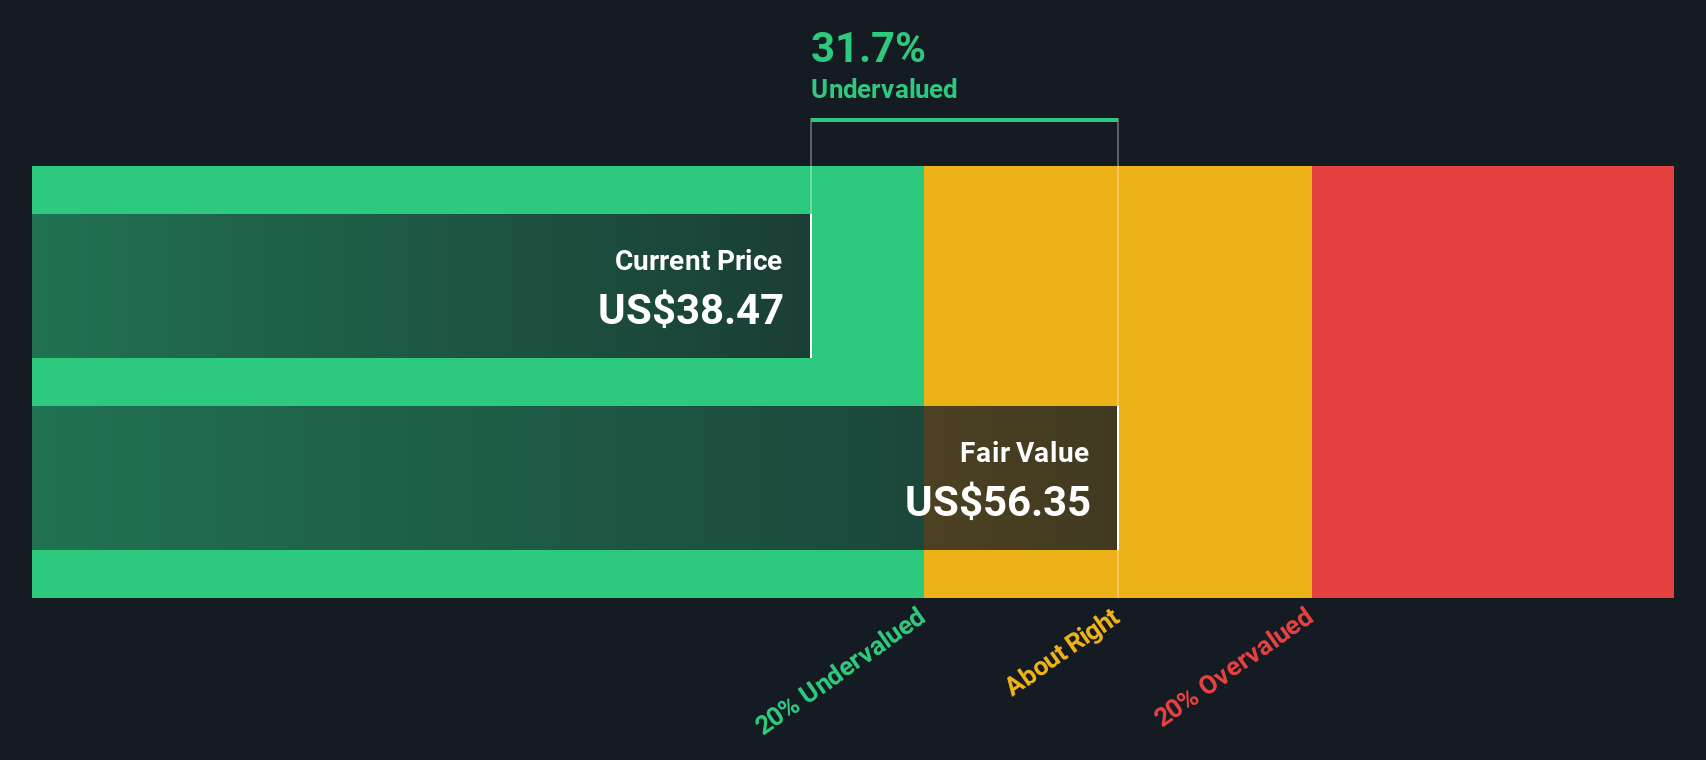
Plugging these numbers into the DCF model produces an estimated intrinsic value per share of $28.26. This is notably higher than the current trading price and suggests the stock is 46.3% undervalued based on these long-term cash flow projections. Despite today's troubled outlook, the market may be overlooking the company’s recovery and future earnings power.
Result: UNDERVALUED
Our Discounted Cash Flow (DCF) analysis suggests FMC is undervalued by 46.3%. Track this in your watchlist or portfolio, or discover 840 more undervalued stocks based on cash flows.
Approach 2: FMC Price vs Sales
The price-to-sales (P/S) ratio is often a preferred valuation multiple for companies in turnaround situations or those with volatile earnings. This is currently the case with FMC. Since profitability has been challenged lately, looking at how much investors are willing to pay for each dollar of FMC’s revenue helps give a clearer sense of what the market expects from the company’s operations, without being distorted by short-term earnings swings.
A "normal" or fair P/S ratio typically reflects expectations for growth, as well as the risk profile of the company and its industry. Higher growth and stronger margins tend to merit higher P/S ratios, while adverse conditions or elevated risks justify a discount to peers or industry averages.
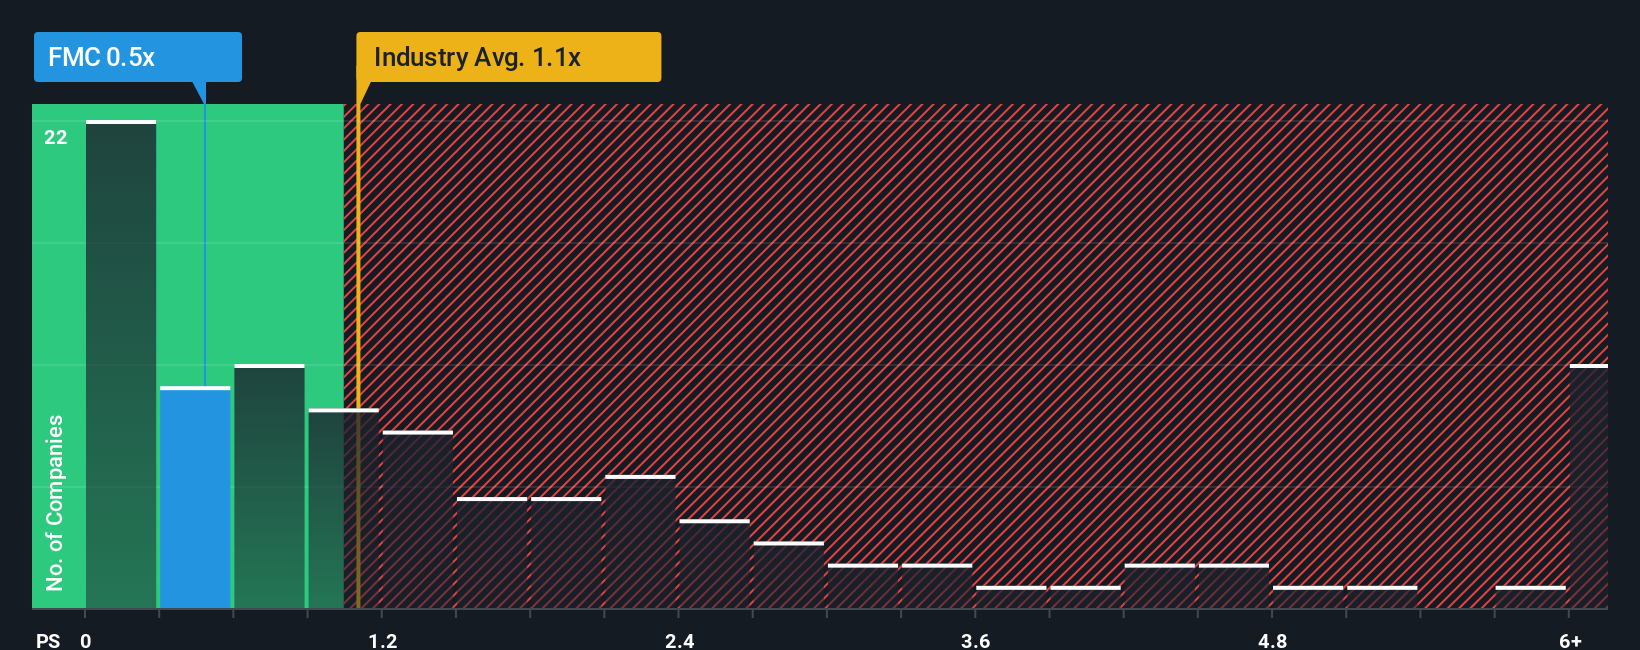
As of now, FMC trades at a P/S ratio of 0.53x, which is notably lower than both the chemicals industry average of 1.19x and its peer group average of 1.13x. On the surface, this suggests the market is pricing in significant caution relative to other companies in the sector.
Simply Wall St’s “Fair Ratio” is a proprietary calculation that estimates what a reasonable P/S multiple should be for FMC. It takes into account not just growth expectations, but also risk factors, profit margins, industry context and company size. This approach is more comprehensive than a simple benchmark comparison, as it is tailored specifically to the company’s prospects and characteristics.
For FMC, the Fair Ratio stands at 1.50x, substantially above today’s multiple of 0.53x. With the share price trading well below what would be expected for a company with similar fundamentals, this suggests meaningful upside on a sales-multiple basis.
Result: UNDERVALUED
PS ratios tell one story, but what if the real opportunity lies elsewhere? Discover 1414 companies where insiders are betting big on explosive growth.
Upgrade Your Decision Making: Choose your FMC Narrative
Earlier we mentioned that there's an even better way to understand valuation, so let's introduce you to Narratives. A Narrative is your personal story or thesis about a company, where you combine your views, assumptions, and insights such as your fair value estimate, expected revenues, growth rates, and margins into a transparent forecast and valuation. Narratives link what you believe about the company's future to specific financial projections and then directly to a fair value for the stock.
This approach turns analysis into something much more dynamic and actionable than any single ratio, and it's incredibly user-friendly. Narratives are available to everyone on the Simply Wall St Community page, used by millions of investors. Narratives help you decide when to buy or sell, allowing you to compare your Fair Value against the current Price, and they automatically update as new news, earnings releases, or key events are published so your view stays relevant.
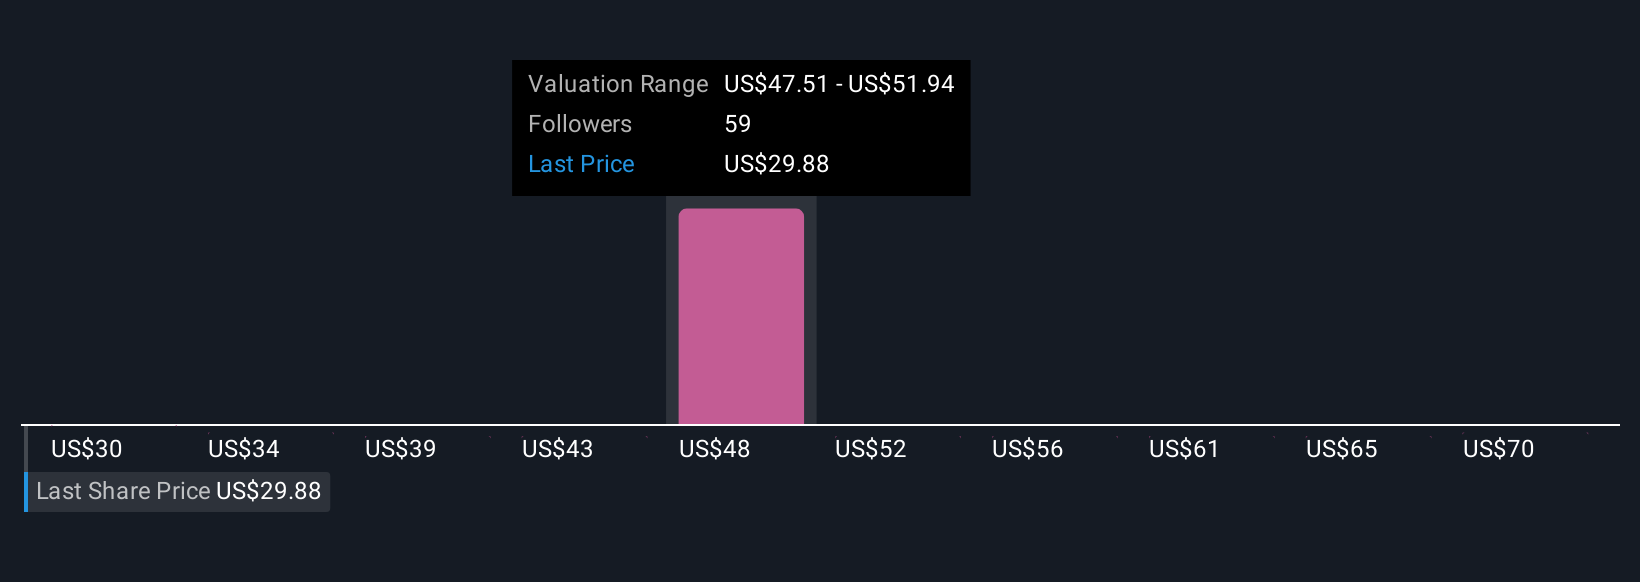
For example, one FMC investor might believe demand for biological crop protection will drive a rapid recovery, supporting a high fair value near $95 per share, while another sees regulatory headwinds and tough competition holding value closer to $37. Through Narratives, you can easily compare both perspectives and see which resonates most with your own research and risk appetite.
Do you think there's more to the story for FMC? Head over to our Community to see what others are saying!
This article by Simply Wall St is general in nature. We provide commentary based on historical data and analyst forecasts only using an unbiased methodology and our articles are not intended to be financial advice. It does not constitute a recommendation to buy or sell any stock, and does not take account of your objectives, or your financial situation. We aim to bring you long-term focused analysis driven by fundamental data. Note that our analysis may not factor in the latest price-sensitive company announcements or qualitative material. Simply Wall St has no position in any stocks mentioned.