Do S&P Global’s (SPGI) PMI Tailwinds and Dividend Plan Reveal a Deeper Data-Moat Strategy?
S&P Global, Inc. SPGI | 0.00 |
- S&P Global’s Board previously approved a third-quarter 2026 cash dividend of US$0.97 per share (US$3.88 annualized), payable on September 10 to shareholders of record on August 26, while its latest PMI data showed US private-sector output expanding at the fastest pace in five months.
- These stronger PMI readings highlight how S&P Global’s economic indicators can shape perceptions of US growth momentum and demand for its data services.
- We’ll now examine how the stronger June PMI readings may influence S&P Global’s investment narrative built around ratings, data, and analytics.
Rare earth metals are an input to most high-tech devices, military and defence systems and electric vehicles. The global race is on to secure supply of these critical minerals. Beat the pack to uncover the 28 best rare earth metal stocks of the very few that mine this essential strategic resource.
S&P Global Investment Narrative Recap
To own S&P Global, you need to believe in enduring demand for its ratings, benchmarks, and data, even when markets cool. The latest stronger US PMI readings support the near term catalyst of robust activity across capital markets and data subscriptions, but they do not materially change the key risk that issuance volumes and client spending could weaken if financing conditions tighten again.
The Board’s approval of a third quarter 2026 dividend of US$0.97 per share, or US$3.88 annualized, is the announcement that ties most closely to this story. It underlines how cash generation from ratings and information services currently supports returns to shareholders, even as S&P Global continues to invest in analytics and AI that many investors view as important to the longer term growth catalyst in Market Intelligence and adjacent segments.
Yet investors should also be aware that rising rates or renewed market stress could still pressure issuance volumes and transaction driven Ratings revenue...
S&P Global's narrative projects $19.3 billion revenue and $6.3 billion earnings by 2029. This requires 7.0% yearly revenue growth and about a $1.5 billion earnings increase from $4.8 billion today.
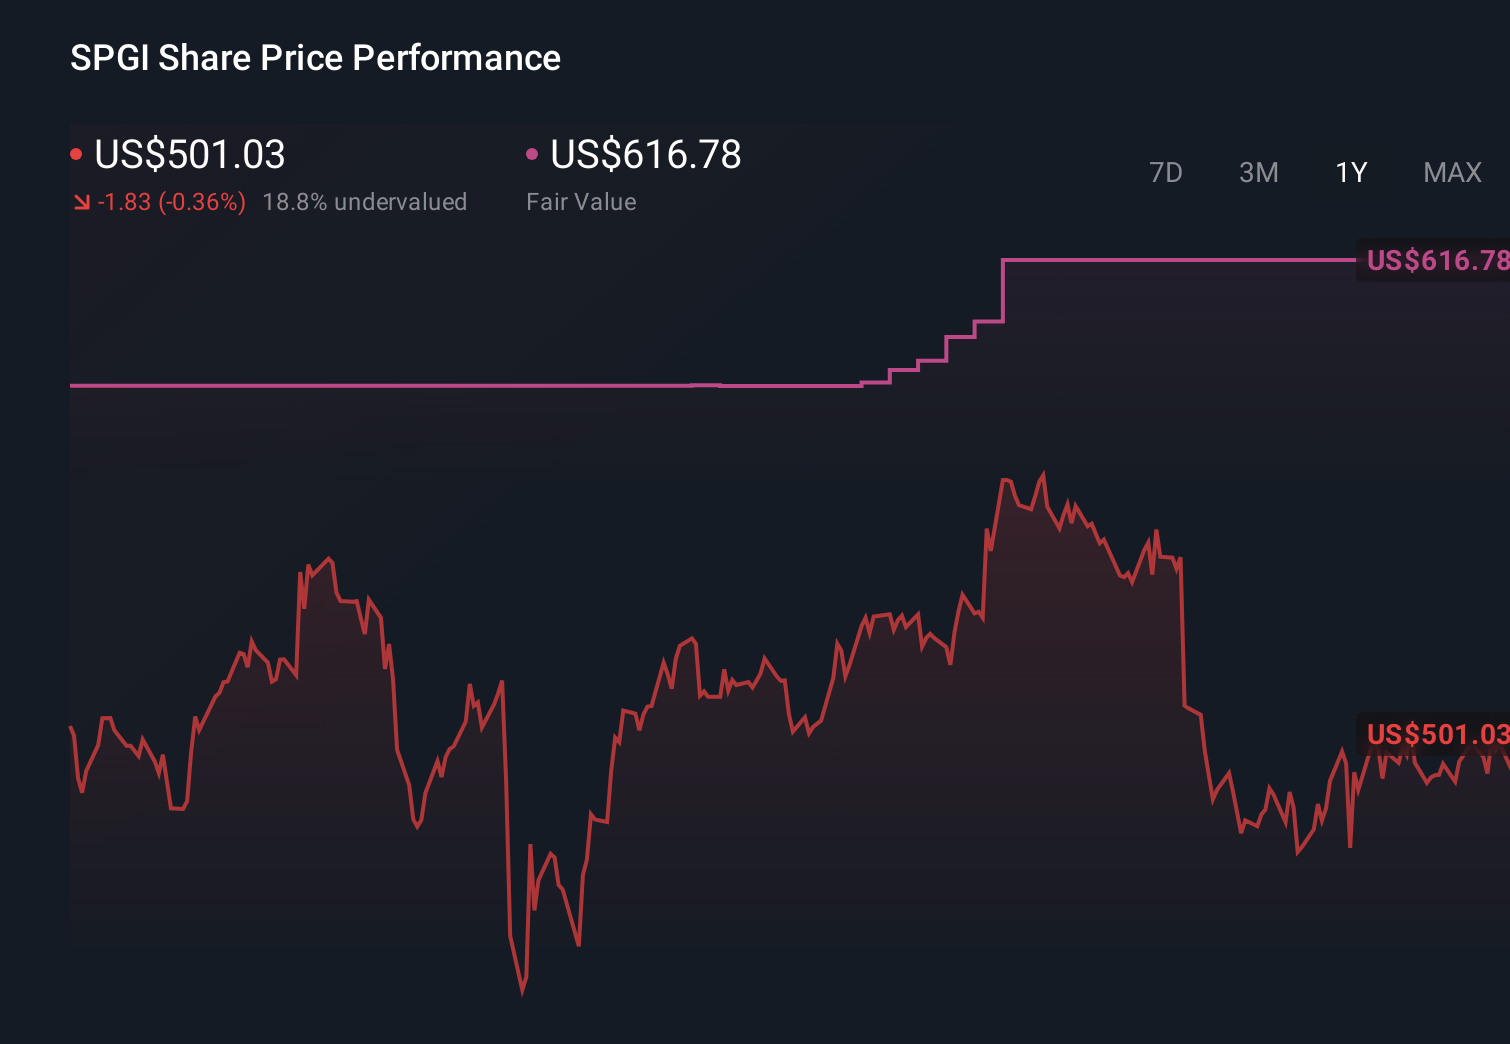
Uncover how S&P Global's forecasts yield a $533.76 fair value, a 35% upside to its current price.
Exploring Other Perspectives
Sixteen fair value estimates from the Simply Wall St Community span roughly US$380 to about US$573 per share, showing how far apart views can be. As you weigh those against S&P Global’s reliance on healthy capital markets for Ratings revenue, it is worth considering how different macro paths could affect the business and exploring several of these alternative viewpoints.
Explore 16 other fair value estimates on S&P Global - why the stock might be worth just $380.00!
The Verdict Is Yours
Disagree with existing narratives? Extraordinary investment returns rarely come from following the herd, so go with your instincts.
- A great starting point for your S&P Global research is our analysis highlighting 4 key rewards that could impact your investment decision.
- Our free S&P Global research report provides a comprehensive fundamental analysis summarized in a single visual - the Snowflake - making it easy to evaluate S&P Global's overall financial health at a glance.
Ready For A Different Approach?
Our top stock finds are flying under the radar-for now. Get in early:
- Outshine the giants: these 16 early-stage AI stocks could fund your retirement.
- AI is about to change healthcare. These 39 stocks are working on everything from early diagnostics to drug discovery. The best part - they are all under $10b in market cap - there's still time to get in early.
- The future of work is here. Discover the 30 top robotics and automation stocks leading the charge in AI-driven automation and industrial transformation.
This article by Simply Wall St is general in nature. We provide commentary based on historical data and analyst forecasts only using an unbiased methodology and our articles are not intended to be financial advice. It does not constitute a recommendation to buy or sell any stock, and does not take account of your objectives, or your financial situation. We aim to bring you long-term focused analysis driven by fundamental data. Note that our analysis may not factor in the latest price-sensitive company announcements or qualitative material. Simply Wall St has no position in any stocks mentioned.