Does Aptiv (APTV) Offer Value After This Year’s 27% Share Price Decline?
Aptiv PLC APTV | 0.00 |
- Wondering if Aptiv's current share price reflects its true worth, or if the recent swings are masking a clearer story about value.
- Aptiv closed at US$57.11, with returns of a 5.2% decline over 7 days, a 1.9% decline over 30 days, a 27.2% decline year to date, but a 10.3% gain over the past year, which can leave the stock looking quite different depending on the time frame you focus on.
- Those mixed returns sit against a backdrop of ongoing attention on Aptiv as an auto components supplier, as investors weigh how the broader sector and company specific developments could affect sentiment. This context is important when you assess whether the recent pullback suggests lower expectations or simply normal volatility.
- Aptiv currently scores 4 out of 6 on our valuation checks, as shown by its valuation score. This hints that some metrics point to undervaluation while others do not. The next sections will walk through the main valuation approaches in turn, and then finish with a way to bring them together into a clearer view of what the stock might be worth to you.
Approach 1: Aptiv Discounted Cash Flow (DCF) Analysis
A Discounted Cash Flow, or DCF, model estimates what a stock could be worth today by projecting the company’s future cash flows and discounting them back to a present value.
For Aptiv, the model uses a 2 Stage Free Cash Flow to Equity approach based on cash flow projections in $. The latest twelve month free cash flow is about $968.3 million. Analysts provide specific free cash flow estimates out to 2030, with projections such as $610.3 million in 2026 and $1,238.7 million in 2027. Further forecasts out to 2035, including an estimated $2,466.3 million in 2035, are extrapolated from these inputs.
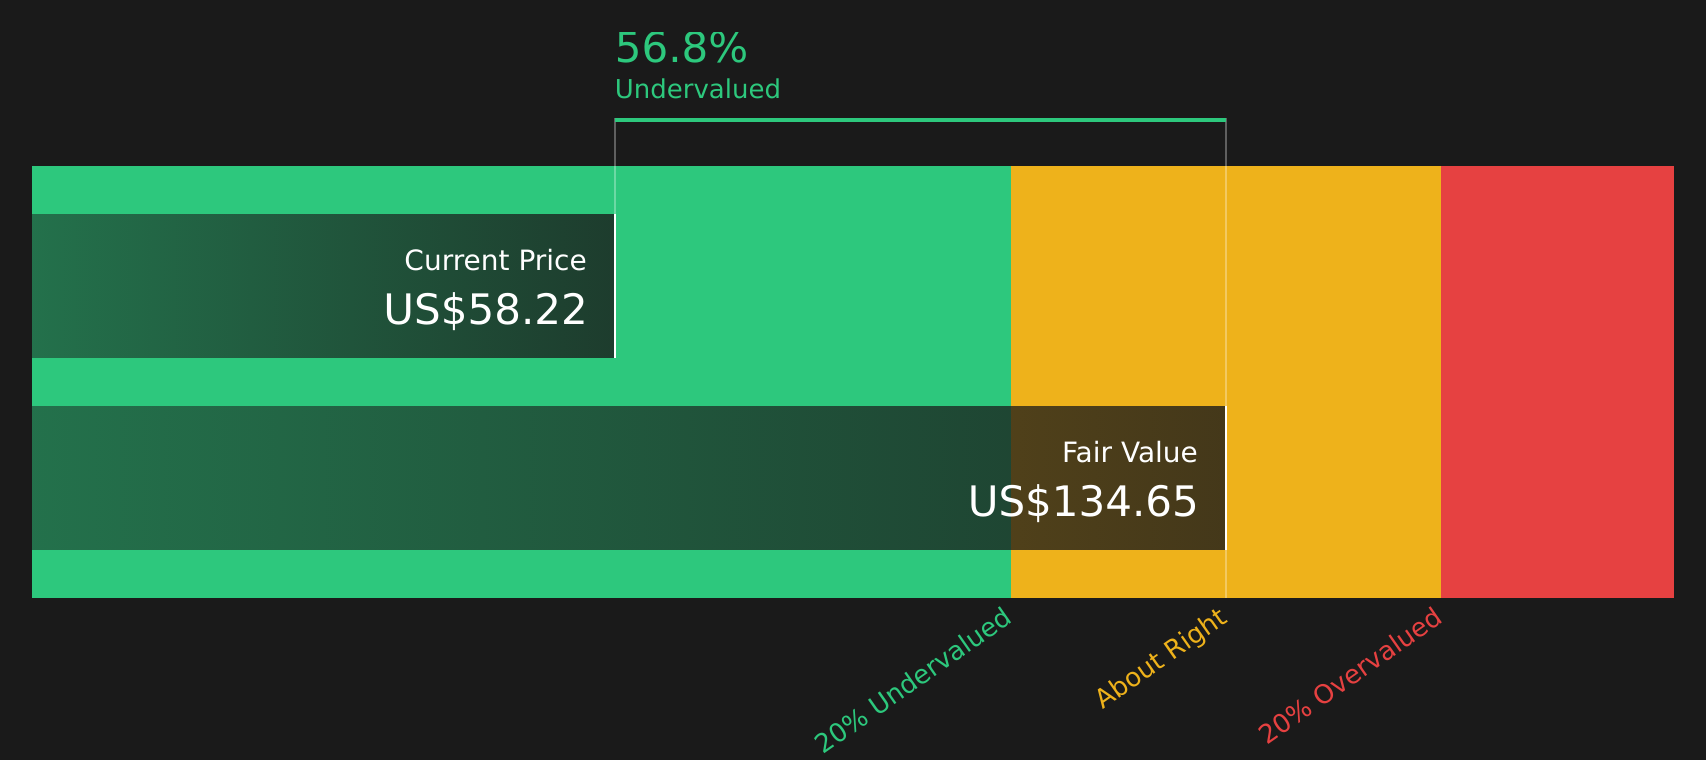
When these projected cash flows are discounted back to today, Simply Wall St’s model arrives at an estimated intrinsic value of about $121.33 per share. Compared with the recent share price of $57.11, this implies a 52.9% discount, which suggests that Aptiv is trading well below this DCF estimate.
Result: UNDERVALUED
Our Discounted Cash Flow (DCF) analysis suggests Aptiv is undervalued by 52.9%. Track this in your watchlist or portfolio, or discover 51 more high quality undervalued stocks.
Approach 2: Aptiv Price vs Earnings
For a profitable business, the P/E ratio is a straightforward way to think about valuation, because it links what you pay for the stock to the earnings it currently generates. Investors usually expect higher P/E ratios when they see stronger earnings growth potential and lower risk, and lower P/E ratios when growth expectations are more modest or risks are higher.
Aptiv trades on a P/E of 33.11x. That is above the Auto Components industry average P/E of 20.23x and also above the peer average of 17.90x, so on simple comparisons the stock looks more expensive than many sector peers. Simply Wall St’s Fair Ratio for Aptiv is 35.23x, which is an internally estimated P/E level that reflects factors such as earnings growth, profitability, industry, market cap and company specific risks.
This Fair Ratio can be more useful than a basic industry or peer comparison because it tries to match Aptiv’s individual profile, rather than assuming it should trade in line with a broad group. Set against the current P/E of 33.11x, the Fair Ratio of 35.23x suggests the stock is somewhat cheaper than this tailored estimate.
Result: UNDERVALUED

P/E ratios tell one story, but what if the real opportunity lies elsewhere? Start investing in legacies, not executives. Discover our 18 top founder-led companies.
Upgrade Your Decision Making: Choose your Aptiv Narrative
Earlier it was mentioned that there is an even better way to understand valuation, so Narratives are Simply Wall St’s way of letting you attach a clear story to your numbers, linking Aptiv’s business outlook to your own revenue, earnings and margin assumptions, and then through to a Fair Value that you can compare with the current price to help decide whether the stock appears attractive or stretched.
Each Narrative is a simple, structured view hosted on the Community page and used by millions of investors. In it, you set out your thesis on Aptiv, the forecasts you think are reasonable, and the P/E you are comfortable with. The platform then converts that into a Fair Value that automatically refreshes as new information such as earnings, news or guidance is added.
For Aptiv, one investor might build a more cautious Narrative that lines up with a Fair Value around US$74 per share, while another might build a more optimistic Narrative around US$107 per share. Seeing that spread in one place can help you decide which set of assumptions sits closer to your view before you act on any buy or sell decision.
Do you think there's more to the story for Aptiv? Head over to our Community to see what others are saying!

This article by Simply Wall St is general in nature. We provide commentary based on historical data and analyst forecasts only using an unbiased methodology and our articles are not intended to be financial advice. It does not constitute a recommendation to buy or sell any stock, and does not take account of your objectives, or your financial situation. We aim to bring you long-term focused analysis driven by fundamental data. Note that our analysis may not factor in the latest price-sensitive company announcements or qualitative material. Simply Wall St has no position in any stocks mentioned.