Does Cheniere Energy Partners' Base‑Plus‑Variable Payout Reveal a New Capital Strategy for CQP?
Cheniere Energy Partners, L.P. CQP | 65.10 | +1.06% |
- Cheniere Energy Partners, L.P. recently declared a quarterly cash distribution of US$0.830 per common unit, comprising a US$0.775 base and a US$0.055 variable component, payable on February 13, 2026, to unitholders of record as of February 9, 2026.
- The blend of a recurring base payout with a smaller variable element highlights how the partnership balances ongoing income needs with flexibility around its liquefied natural gas export operations and tax considerations for foreign investors.
- We will now examine how this base-plus-variable distribution framework shapes Cheniere Energy Partners’ investment narrative for income-focused unitholders.
Outshine the giants: these 24 early-stage AI stocks could fund your retirement.
What Is Cheniere Energy Partners' Investment Narrative?
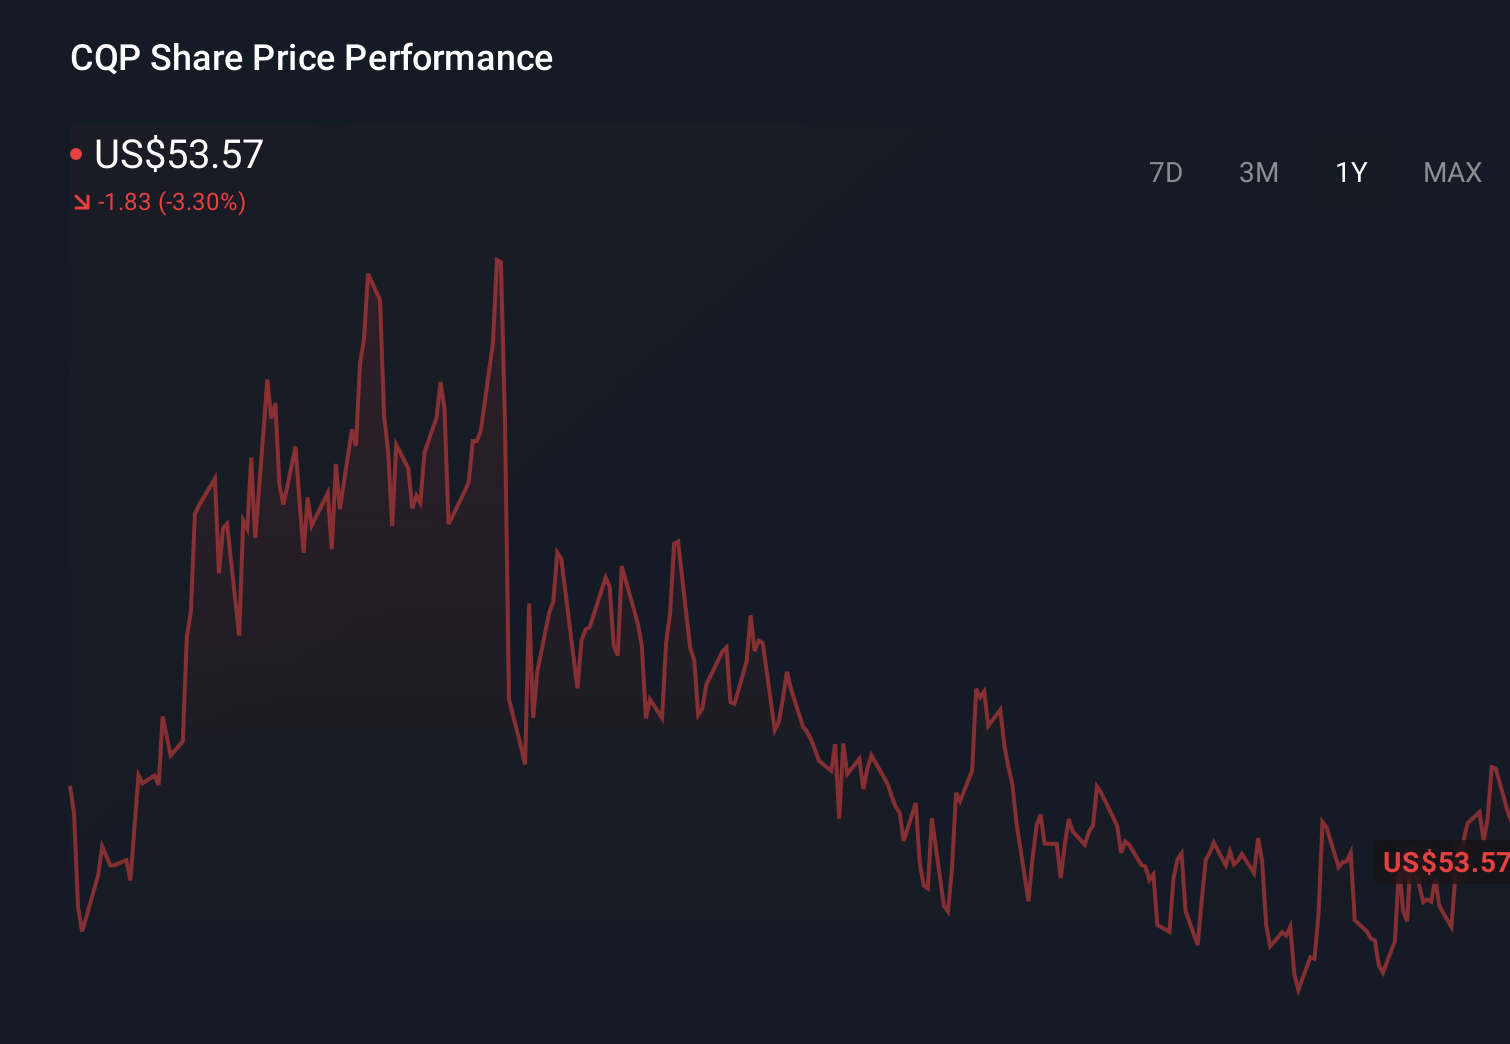
To own Cheniere Energy Partners, you have to be comfortable with a mature LNG export partnership that offers steady, but not rapidly expanding, earnings and revenue, and a valuation that already sits slightly above both consensus analyst targets and some discounted cash flow estimates. The latest US$0.830 per‑unit base‑plus‑variable distribution reinforces the income story without really shifting the near term catalysts, which remain tied to contract renewals, LNG export volumes and debt service. With profit margins lower than last year and debt not well covered by operating cash flow, the key question is how resilient those distributions are if market conditions tighten. Recent unit price performance, including a 1‑year total return decline despite healthy multi‑year gains, suggests the market is already cautious, so this new payout mainly underlines existing strengths and risks rather than creating a new inflection point.
Yet behind the reliable distributions, one balance sheet issue stands out that investors should not ignore.
Cheniere Energy Partners' share price has been on the slide but might be dropping deeper into value territory. Find out whether it's a bargain at this price.Exploring Other Perspectives
Explore 2 other fair value estimates on Cheniere Energy Partners - why the stock might be worth as much as $55.40!
Build Your Own Cheniere Energy Partners Narrative
Disagree with this assessment? Create your own narrative in under 3 minutes - extraordinary investment returns rarely come from following the herd.
- A great starting point for your Cheniere Energy Partners research is our analysis highlighting 1 key reward and 3 important warning signs that could impact your investment decision.
- Our free Cheniere Energy Partners research report provides a comprehensive fundamental analysis summarized in a single visual - the Snowflake - making it easy to evaluate Cheniere Energy Partners' overall financial health at a glance.
Want Some Alternatives?
The market won't wait. These fast-moving stocks are hot now. Grab the list before they run:
- AI is about to change healthcare. These 110 stocks are working on everything from early diagnostics to drug discovery. The best part - they are all under $10b in market cap - there's still time to get in early.
- Trump has pledged to "unleash" American oil and gas and these 22 US stocks have developments that are poised to benefit.
- The end of cancer? These 29 emerging AI stocks are developing tech that will allow early identification of life changing diseases like cancer and Alzheimer's.
This article by Simply Wall St is general in nature. We provide commentary based on historical data and analyst forecasts only using an unbiased methodology and our articles are not intended to be financial advice. It does not constitute a recommendation to buy or sell any stock, and does not take account of your objectives, or your financial situation. We aim to bring you long-term focused analysis driven by fundamental data. Note that our analysis may not factor in the latest price-sensitive company announcements or qualitative material. Simply Wall St has no position in any stocks mentioned.