

Does Cushman & Wakefield’s (CWK) Earnings Setup Reveal Durable Strength in Its Industrial Fee Engine?
CUSHMAN & WAKEFIELD PLC CWK | 0.00 |
- Recently, Cushman & Wakefield was highlighted for its pattern of outperforming earnings expectations and its current combination of a positive Earnings ESP and favorable Zacks Rank, while also reporting that the U.S. industrial market strengthened in Q2 2026 with balanced demand and supply and vacancy dipping below 7%.
- Together, Cushman & Wakefield’s earnings beat potential and signs of healthier industrial fundamentals point to stronger perceived execution in key fee-generating segments.
- We’ll now examine how Cushman & Wakefield’s earnings beat potential could reshape its existing investment narrative and risk-return profile.
Capitalize on the AI infrastructure supercycle with our selection of the 55 best 'picks and shovels' of the AI gold rush converting record-breaking demand into massive cash flow.
Cushman & Wakefield Investment Narrative Recap
To own Cushman & Wakefield, you need to believe its fee-driven model can offset cyclicality in leasing and capital markets with growing, higher-quality services income. The fresh signs of a firmer U.S. industrial market and the company’s recent pattern of earnings surprises support that view in the near term, but they do little to reduce the core risk that a downturn in commercial real estate activity could still weigh heavily on transactional revenues.
The most relevant recent development here is Cushman & Wakefield’s addition to the Russell 2000 Defensive Index in June 2026, which reinforces the idea that a larger share of its business is viewed as more recurring and resilient. Set against the new U.S. industrial data and its current positive earnings setup, this index inclusion adds context to the catalyst that Cushman & Wakefield might gradually shift its profile toward steadier fee streams, even as cyclical risks remain.
But against this improved industrial tone, investors should still be aware of how exposed Cushman & Wakefield remains to a sudden drop in leasing and capital markets...
Cushman & Wakefield’s narrative projects $12.4 billion revenue and $416.8 million earnings by 2029. This requires 5.6% yearly revenue growth and about a $343 million earnings increase from $73.7 million today.
Uncover how Cushman & Wakefield's forecasts yield a $17.50 fair value, a 38% upside to its current price.
Exploring Other Perspectives
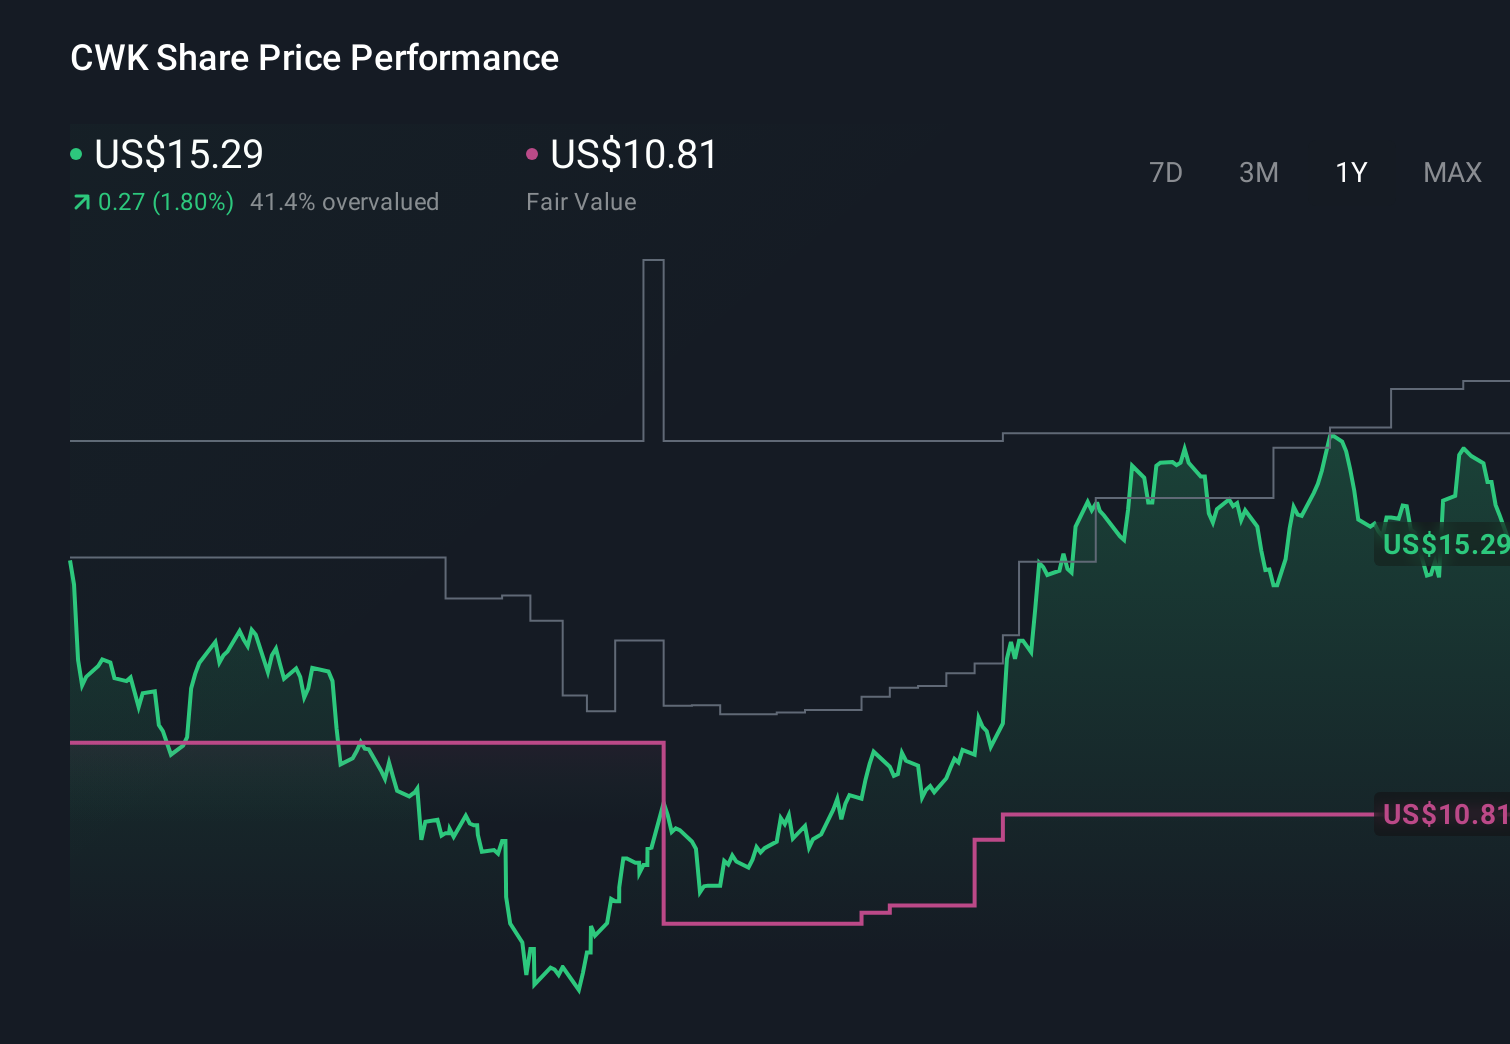
Some of the lowest ranked analysts see a very different picture, expecting revenue of about US$11.9 billion and earnings of roughly US$393 million by 2029, which is far more cautious than the more optimistic views and could shift further once the latest industrial strength and earnings beat potential are fully reflected.
Explore 2 other fair value estimates on Cushman & Wakefield - why the stock might be worth over 2x more than the current price!
Reach Your Own Conclusion
Disagree with existing narratives? Extraordinary investment returns rarely come from following the herd, so go with your instincts.
- A great starting point for your Cushman & Wakefield research is our analysis highlighting 3 key rewards and 4 important warning signs that could impact your investment decision.
- Our free Cushman & Wakefield research report provides a comprehensive fundamental analysis summarized in a single visual - the Snowflake - making it easy to evaluate Cushman & Wakefield's overall financial health at a glance.
Looking For Alternative Opportunities?
Early movers are already taking notice. See the stocks they're targeting before they've flown the coop:
- Find 49 companies with promising cash flow potential yet trading below their fair value.
- Invest in the nuclear renaissance through our list of 90 elite nuclear energy infrastructure plays powering the global AI revolution.
- Rare earth metals are an input to most high-tech devices, military and defence systems and electric vehicles. The global race is on to secure supply of these critical minerals. Beat the pack to uncover the 29 best rare earth metal stocks of the very few that mine this essential strategic resource.
This article by Simply Wall St is general in nature. We provide commentary based on historical data and analyst forecasts only using an unbiased methodology and our articles are not intended to be financial advice. It does not constitute a recommendation to buy or sell any stock, and does not take account of your objectives, or your financial situation. We aim to bring you long-term focused analysis driven by fundamental data. Note that our analysis may not factor in the latest price-sensitive company announcements or qualitative material. Simply Wall St has no position in any stocks mentioned.