

Does EMCOR Group’s (EME) Dividend Amid Index Removals Reveal a Shifting Risk Profile?
EMCOR Group, Inc. EME | 0.00 |
- EMCOR Group, Inc. previously declared a regular quarterly cash dividend of US$0.40 per share, paid on July 31, 2026, to shareholders of record as of July 15, 2026, while the company was also removed from several Russell value and growth indices in late June 2026.
- This combination of a maintained dividend and broad index removals creates a contrast between income stability for existing shareholders and potential shifts in institutional ownership and liquidity.
- Now we'll examine how the affirmed dividend amid wide index removals may influence EMCOR Group's existing investment narrative and risk profile.
Explore 26 top quantum computing companies leading the revolution in next-gen technology and shaping the future with breakthroughs in quantum algorithms, superconducting qubits, and cutting-edge research.
EMCOR Group Investment Narrative Recap
To own EMCOR Group, you generally need to believe its record backlog in data centers, healthcare, and complex infrastructure can keep translating into solid earnings while it manages labor and project execution risks. The recent combination of a maintained US$0.40 dividend and broad Russell index removals does not materially change that core thesis in the short term, but it may slightly influence trading liquidity and how some institutional investors access the stock.
Among recent announcements, the reaffirmed US$0.40 quarterly dividend stands out next to the index removals, because it highlights management’s focus on providing a predictable income stream even as some benchmark-linked funds may adjust their holdings. For investors watching catalysts such as large multi-year projects and the integration of Miller Electric, that dividend continuity can be read as one more piece of information about how EMCOR is positioning itself during a period of index reshuffling...
EMCOR Group's narrative projects $21.5 billion revenue and $1.6 billion earnings by 2029. This requires 6.6% yearly revenue growth and about a $0.3 billion earnings increase from $1.3 billion today.
Uncover how EMCOR Group's forecasts yield a $983.50 fair value, a 28% upside to its current price.
Exploring Other Perspectives
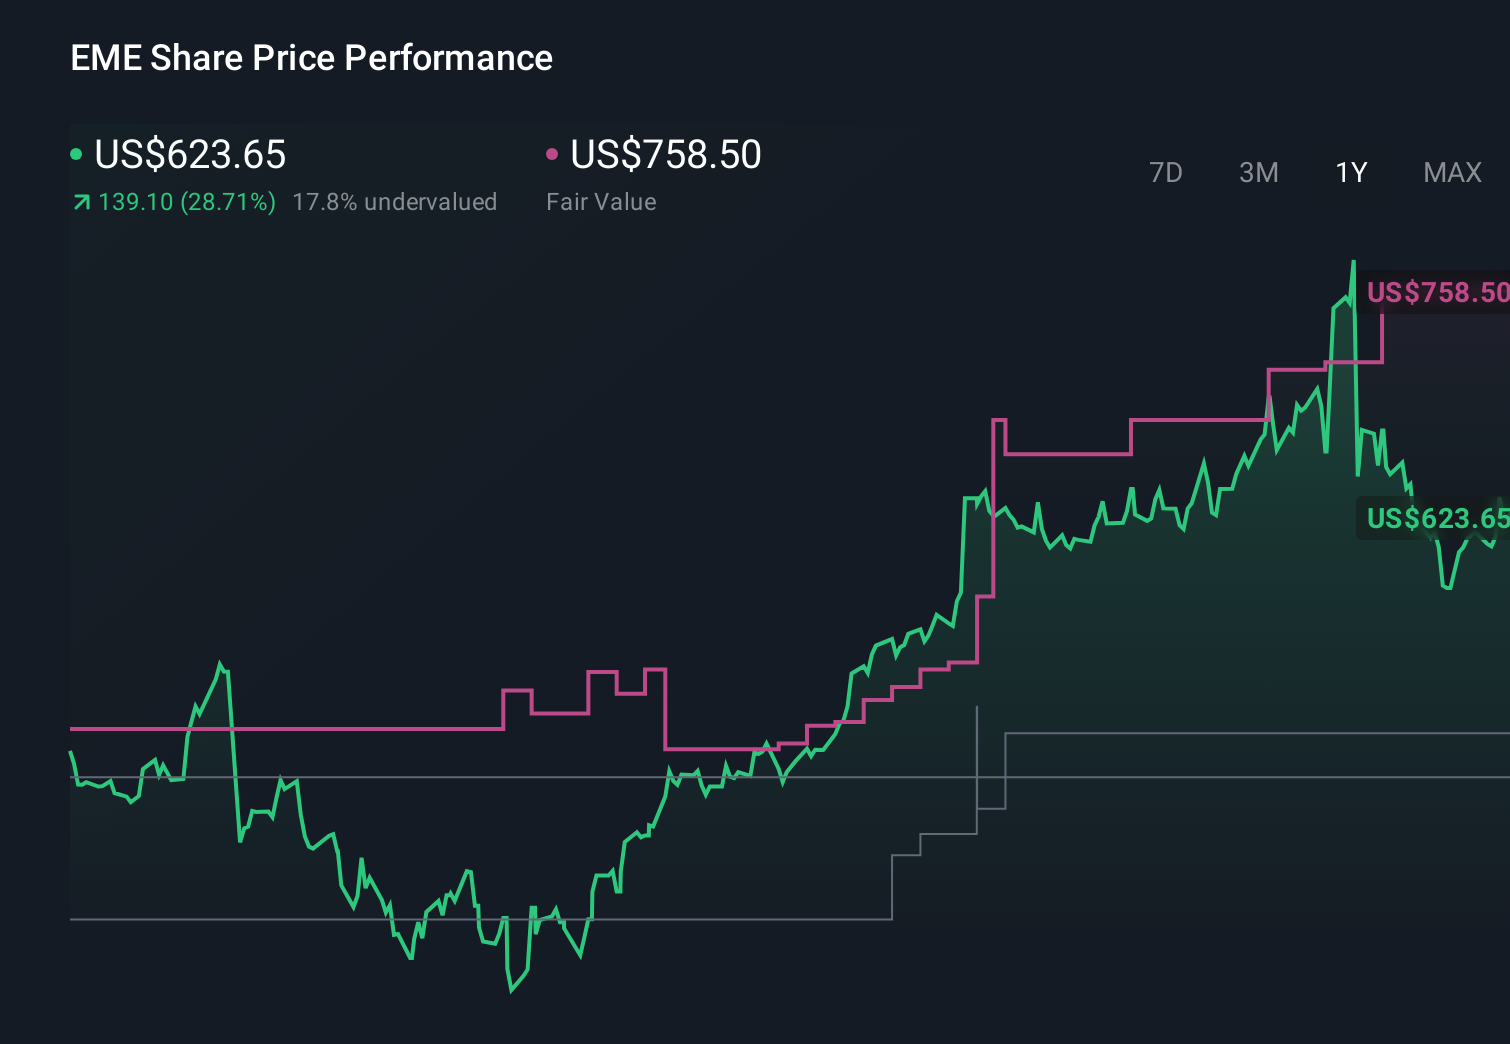
By contrast, the most optimistic analysts were already modeling EMCOR to reach roughly US$25.0 billion in revenue and about US$2.1 billion in earnings, which takes a much stronger view on its ability to turn multi-phase, complex projects into long term profit growth than the baseline narrative, and this new mix of dividend stability and index removals might prompt you to revisit how confident you are in those assumptions.
Explore 5 other fair value estimates on EMCOR Group - why the stock might be worth as much as 65% more than the current price!
The Verdict Is Yours
Don't just follow the ticker - dig into the data and build a conviction that's truly your own.
- A great starting point for your EMCOR Group research is our analysis highlighting 5 key rewards and 1 important warning sign that could impact your investment decision.
- Our free EMCOR Group research report provides a comprehensive fundamental analysis summarized in a single visual - the Snowflake - making it easy to evaluate EMCOR Group's overall financial health at a glance.
Looking For Alternative Opportunities?
Every day counts. These free picks are already gaining attention. See them before the crowd does:
- Uncover the next big thing with 20 elite penny stocks that balance risk and reward.
- AI is about to change healthcare. These 40 stocks are working on everything from early diagnostics to drug discovery. The best part - they are all under $10b in market cap - there's still time to get in early.
- The future of work is here. Discover the 29 top robotics and automation stocks leading the charge in AI-driven automation and industrial transformation.
This article by Simply Wall St is general in nature. We provide commentary based on historical data and analyst forecasts only using an unbiased methodology and our articles are not intended to be financial advice. It does not constitute a recommendation to buy or sell any stock, and does not take account of your objectives, or your financial situation. We aim to bring you long-term focused analysis driven by fundamental data. Note that our analysis may not factor in the latest price-sensitive company announcements or qualitative material. Simply Wall St has no position in any stocks mentioned.